**This module is still in [BETA] development. We need your feedback & suggestions to help us develop it further for the benefit of all.**
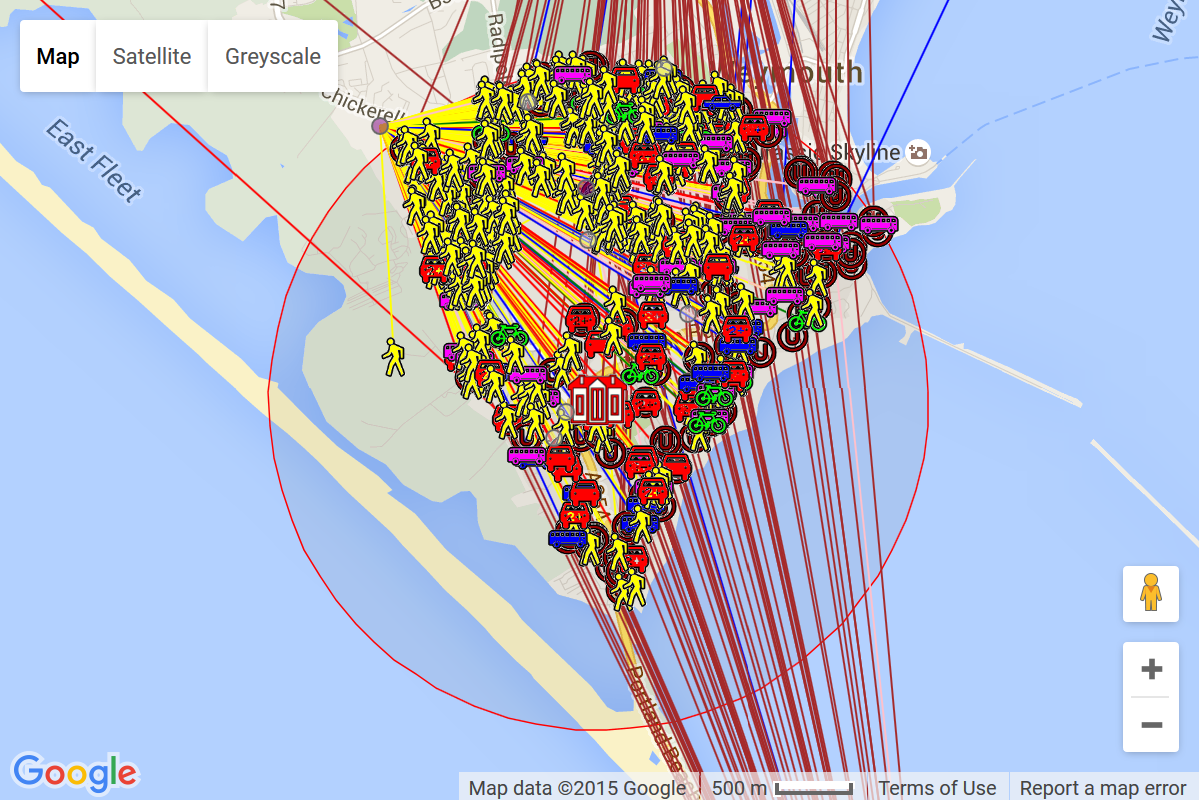
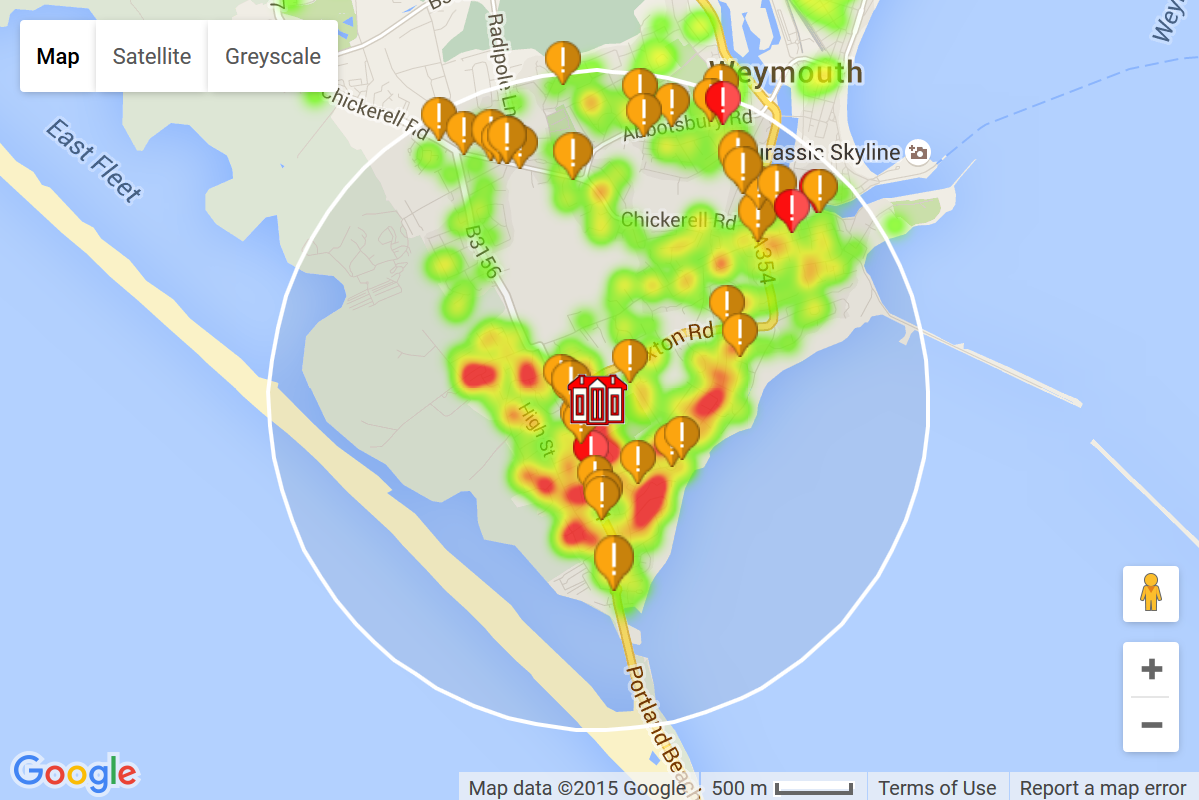
The STHC Proximity & Pupil Choice Analysis module quantifies the proximity of schools to pupils, pupils to schools, and schools to each other, and visualises the results as interactive maps, charts and tables. By looking at the proximity of pupils to ALL schools, not just the one they actually attend, stakeholders can see the consequences of current pupil travel choices and begin to think how they might encourage more pupils to choose their local school rather than travel to schools further afield (often by car).
The STHC spatial analysis shows that, for all schools in ...
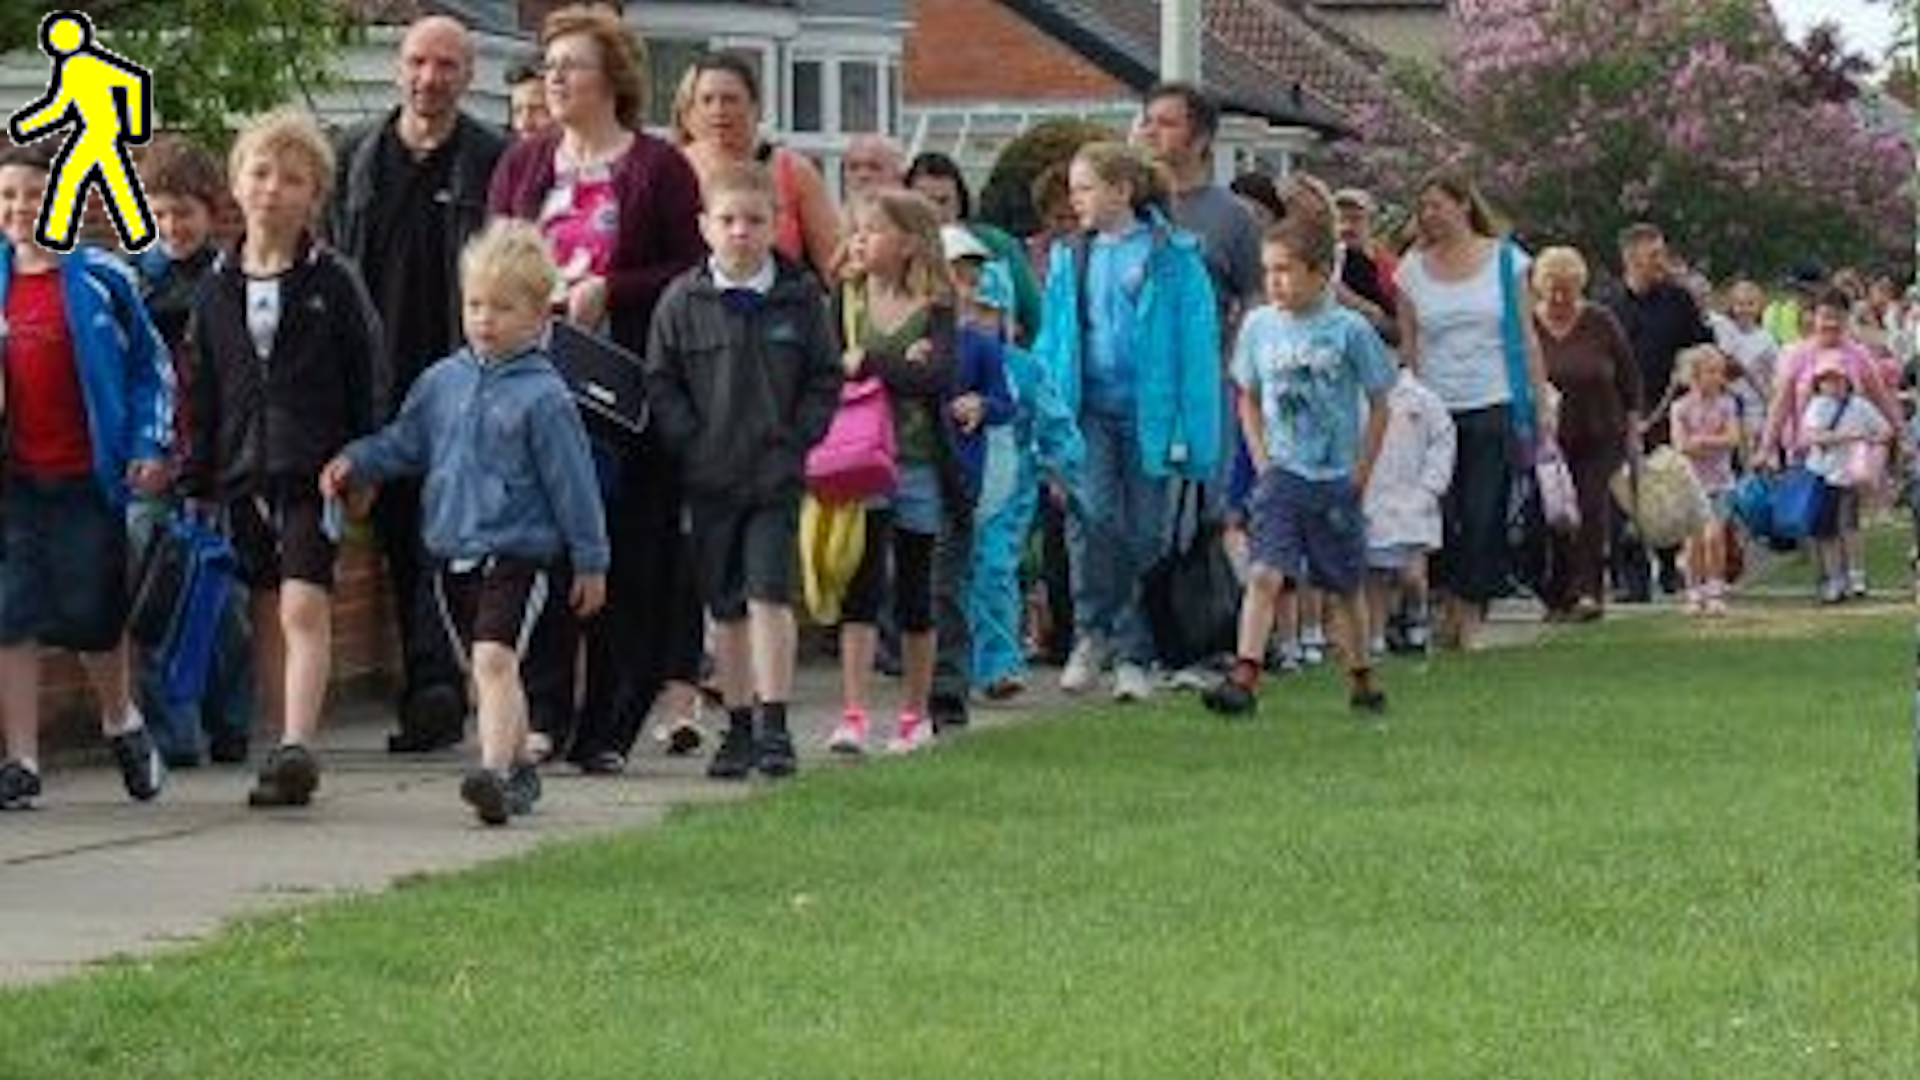
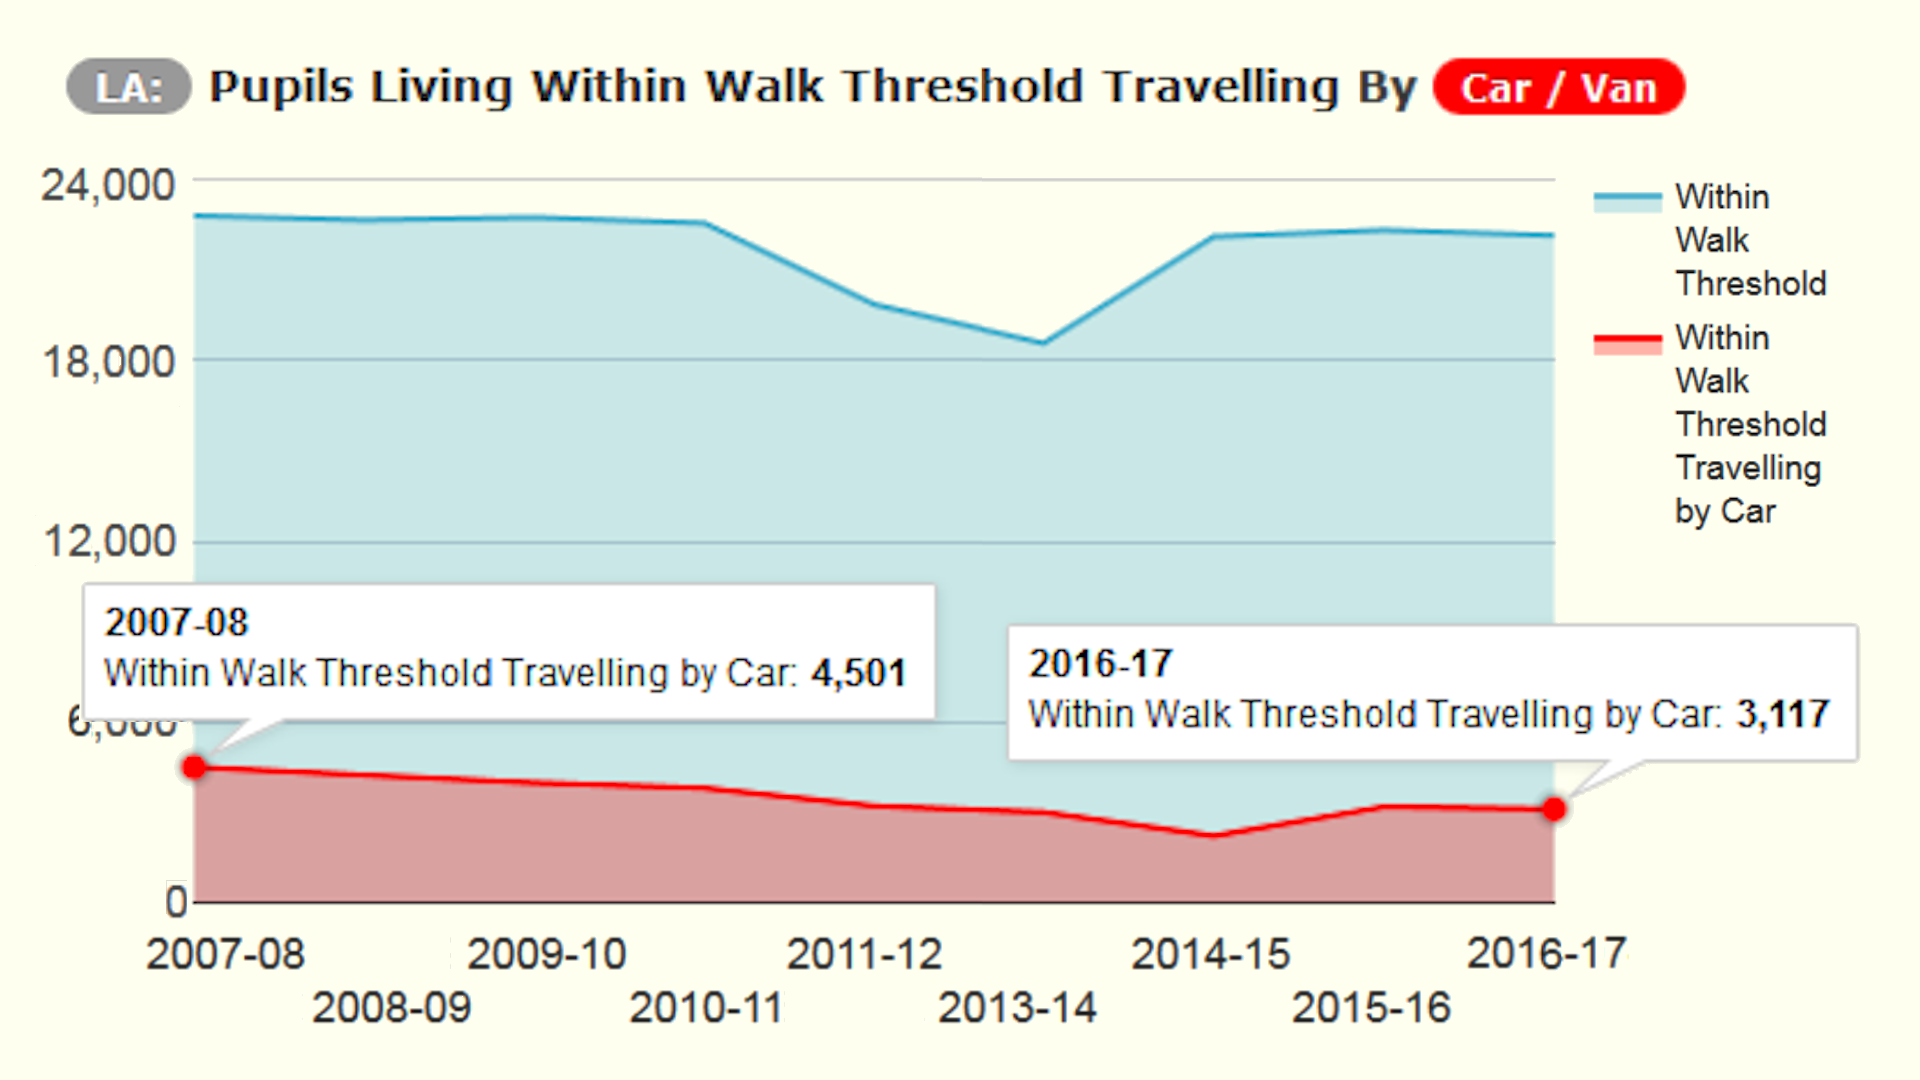
of the total pupils (%) live within a realistic Walk Threshold of the school they actually attend.

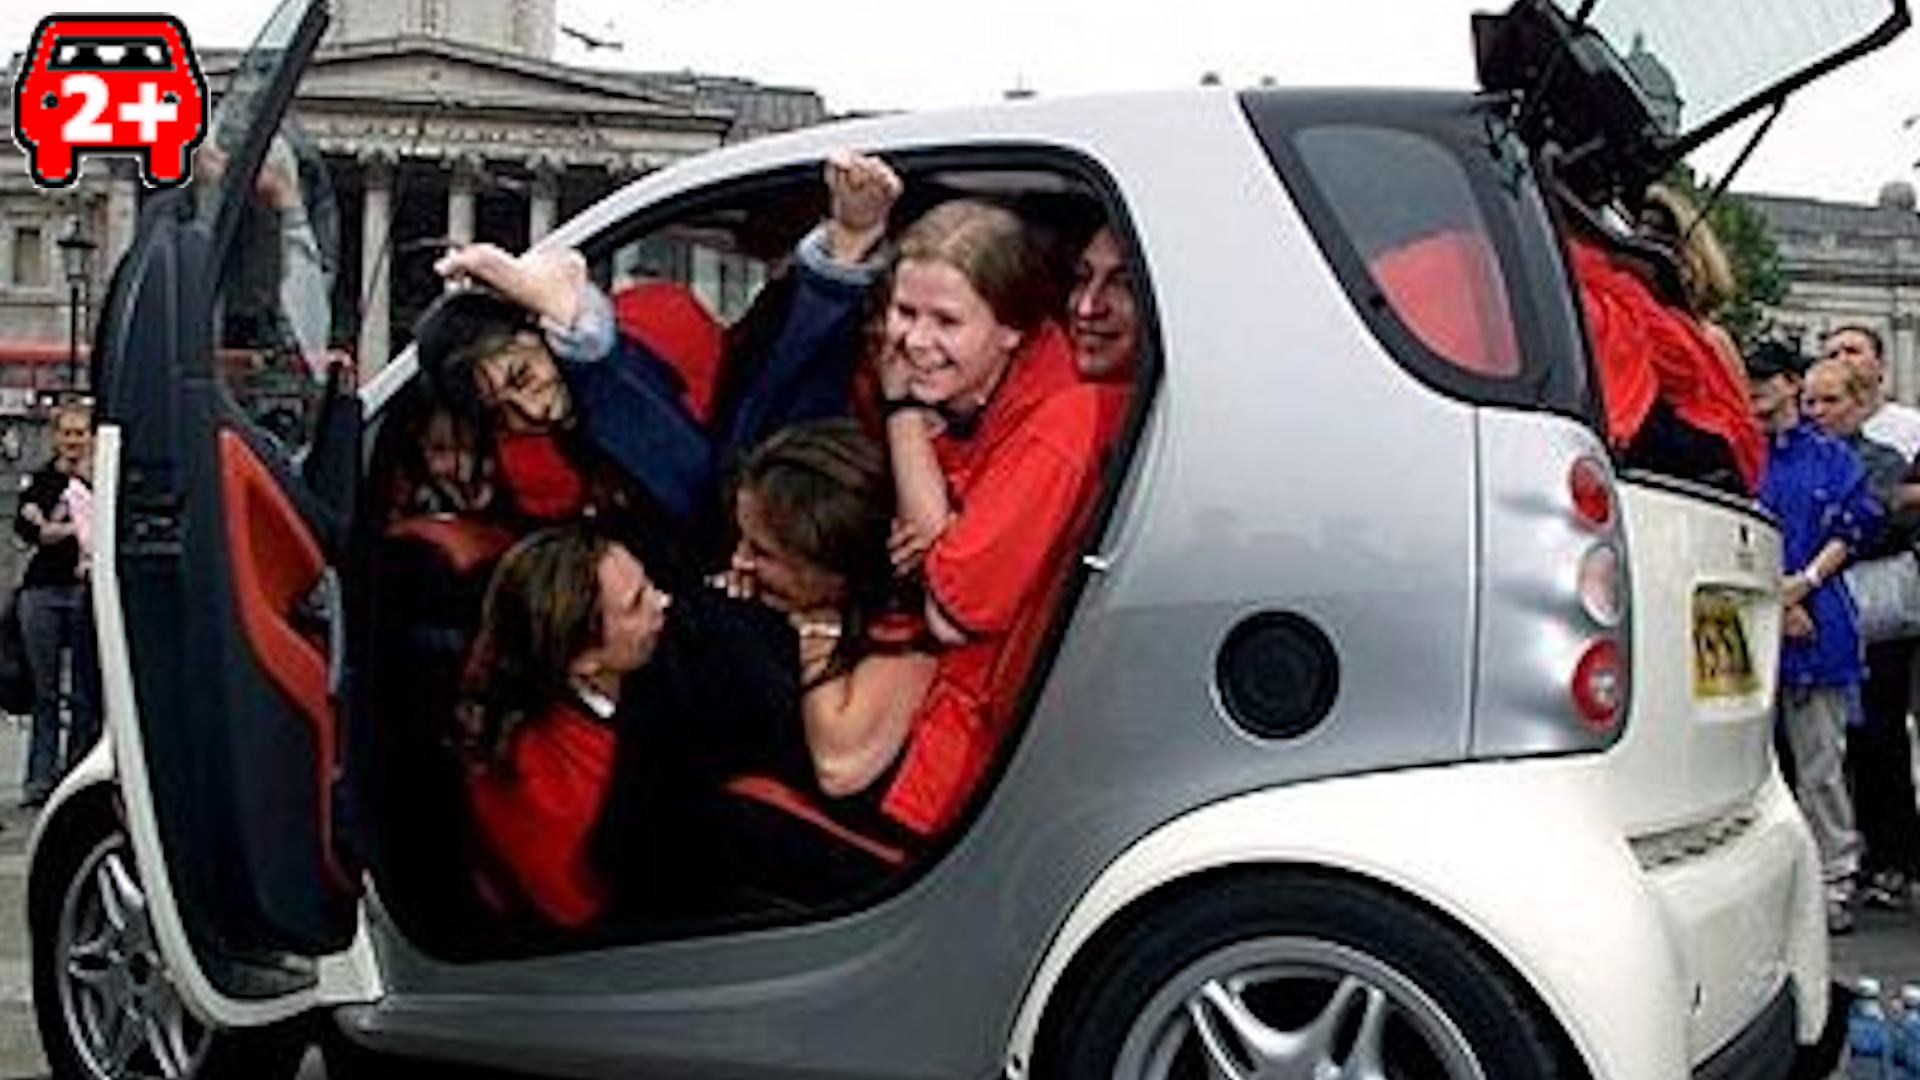
... however of these pupils (%) are still driven to school by car / van (CAR).

of the total pupils (%) are attending their nearest eligible school.
Which means that of the total pupils (%) are NOT attending their nearest eligible school.

This adds up to an extra km travelled on each "school run" (an average of km per pupil).
In other words, if every pupil went to their nearest eligible school, each "school run" would be reduced by km (%), potentially saving up to kg CO2.
At 2 "school runs" a day, and 190 days in the school year, that would add up to an annual saving of millionkm, and up to millionkg CO2!
And that's not taking into account the likely switch to walking and cycling due to the shorter journeys!
...plus loads more facts about the proximity of pupils and schools that can only be deduced using spatial analysis.
‹
›
To view the pages in this module, use the buttons below, or the "Proximity & Choice" menu above. Both options are available on every page on the portal.
Applications & Benefits
There are many practical applications & benefits of the STHC Proximity & Pupil Choice spatial analysis. This list will expand as we further develop the module with the help of our users:-
Quantitative profiling of the walk threshold area around a school in terms of all eligible pupils, not just those that attend it
For example "in a given school, the total number of eligible pupils living within its walk threshold is X. Of these, Y pupils actually attend the school, whilst Z pupils go to other schools that are further away". As well as the social implications for the surrounding community, this "doorstep leakage" also represents a potential loss of funding for the school (which could be a critical if it is operating at less than full capacity).
"Next level" SMART targeting of individual schools for behaviour changing modeshift
For example "in a given schools walk threshold, X number of pupils are driving Y number of miles to various other schools, which is Z "child miles" more than if they walked to this school on their own doorstep".
Quantifying the "pulling power" of each school
Based on how many other eligible schools are nearer to a pupil. For example "for all the pupils attending a given school, for X% it is their closest, for Y% it is their second closest, for Z% their third, and so on..."
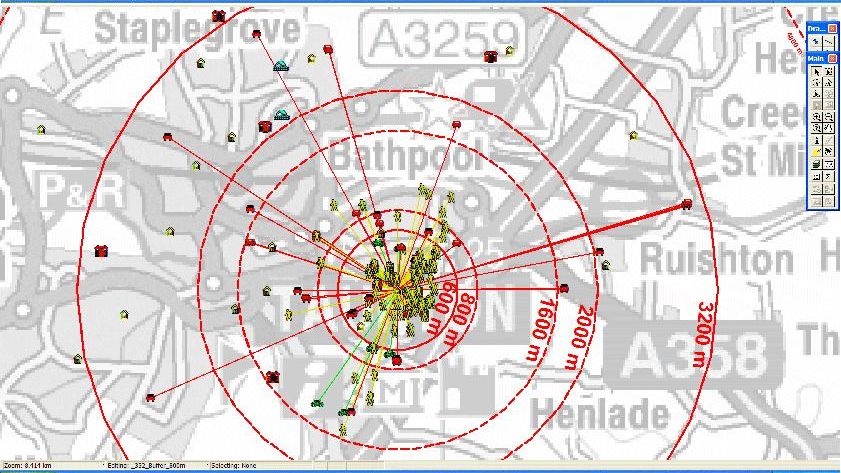
Quantifying the proximity of schools to each other in terms of reasonable walking distances
For example "for a given school, X other schools of similar type are physically located within it's walk threshold, whilst its walk threshold at least intersects with Y other schools". This gives a measure of what competition a school faces locally for pupils.
More accurate socio-geo-demographic profiling of schools based on where the pupils live, not where the school is located
For example "for a given school, by looking at at the home postcodes of the pupils rather than where it is located, it is actually within the top-most 10% of most deprived schools in the LA and so is now eligible for extra funding".
BACK TO SECTION TOP
BACK TO TOP OF PAGE
 More About The
Pupil Proximity
& Choice Analysis
Module
Click the button to find out even more about the Proximity & Pupil Choice Analysis Module on this STHC Data Portal if required. Click on one of the buttons at the top of the section to go to a page of interest, or use the header menu....