Dear Head Teacher
Welcome to your new School Travel Health Check School Pack. The STHC (www.sthc.co.uk), which has been commissioned annually in since 2007-08, undertakes spatial analysis of the School Census and Pupil Usual Mode Of Travel data provided by your school to Dorset County Council in the spring term (spring 2017 is the latest available). The results are published as easily digestible information resources in the form of the Report, Pupil Travel Maps and Key Results Table in this STHC Pack sent to all schools, and a publicly accessible, interactive, online STHC Data Portal at www.sthc.co.uk/portals/dorset (see the enclosed Portal Quick Start guide).
The STHC resources visualise and quantify at whole-authority and individual school level:-
- How far pupils currently travel to school, from where, and by what means.
- How each school compares to any other school in the authority, and to the authority average as a whole.
- How this has changed over time.
- The impact this has on pupils and the environment.
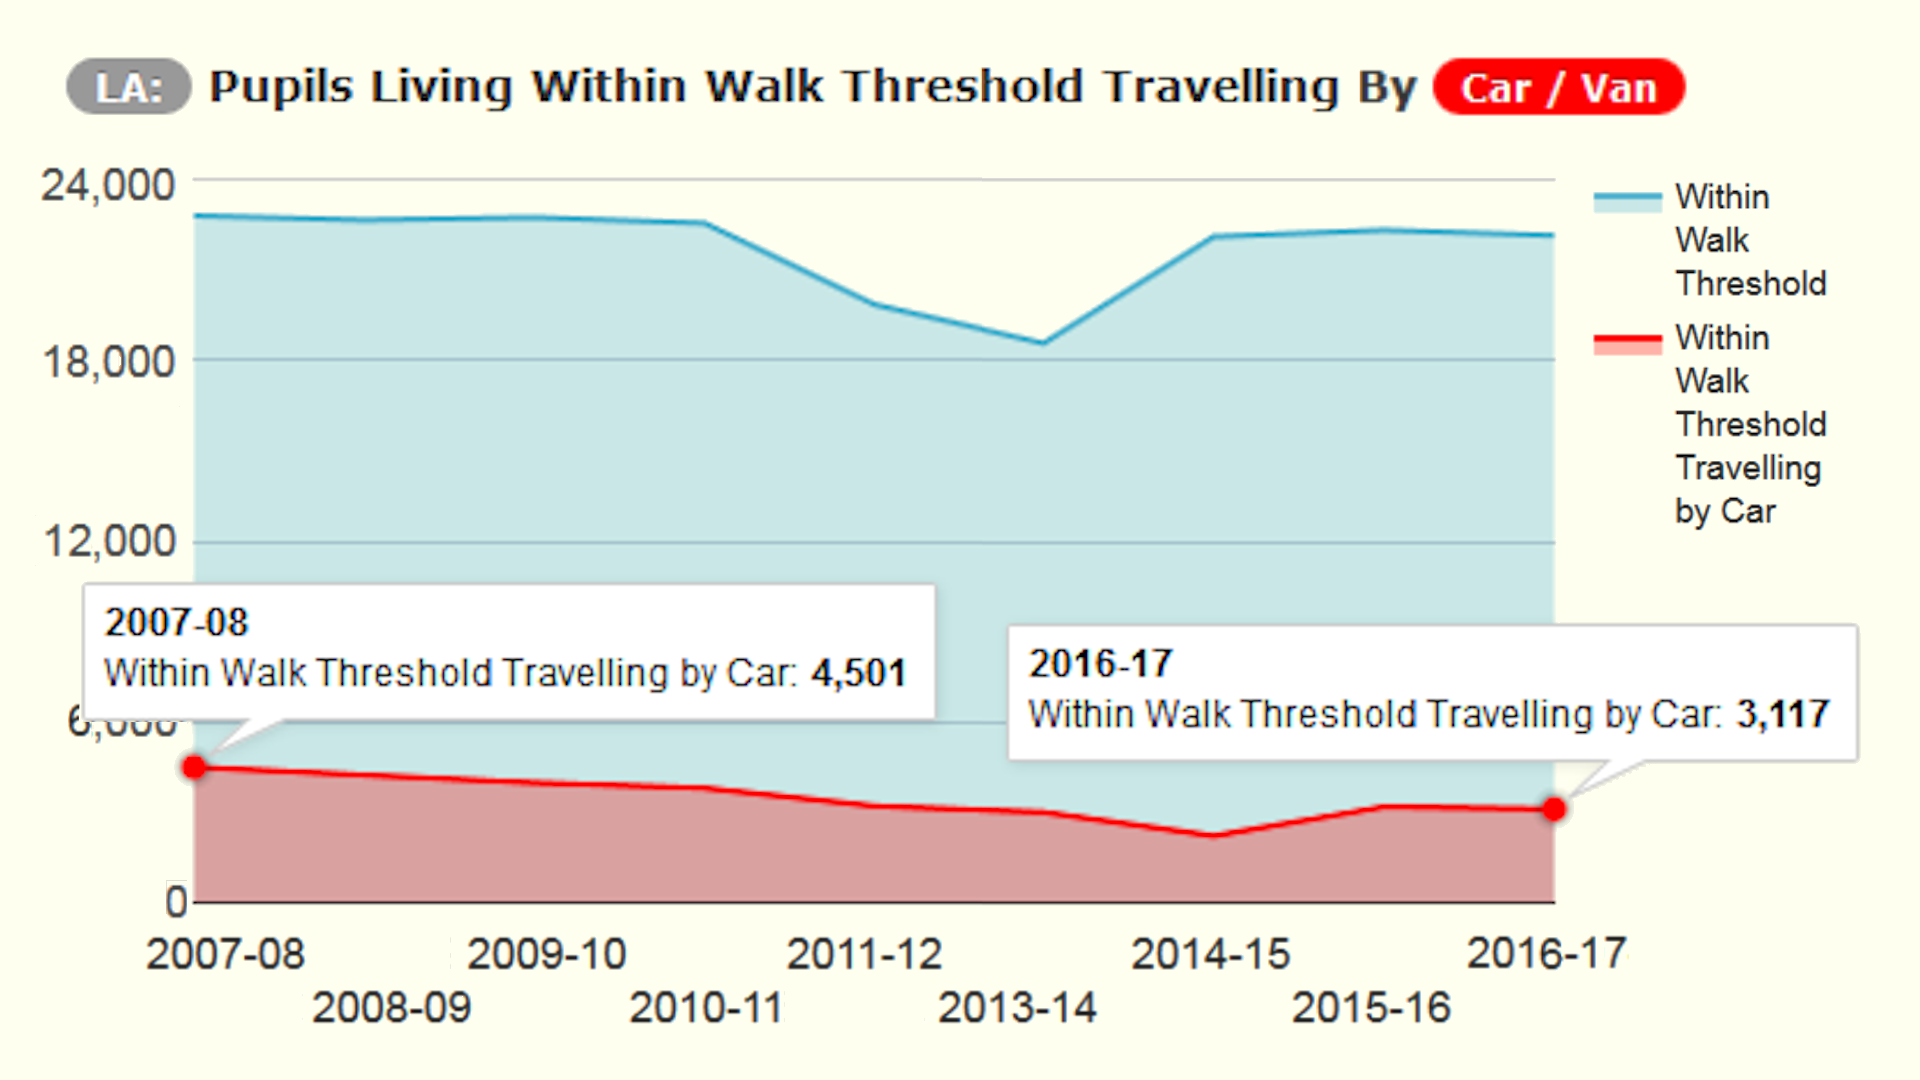
Whilst there is no single solution to reduce the number of "child miles" travelled by Car / Van on the school run, individual schools like yours can play their part at a local level. The spatial nature of the STHC analysis enables us to see that collectively, progress has been made by schools.
For example as you can see from the chart above, since the STHC began there has been nearly a 30% reduction in the number of pupils that live within a reasonable walking distance of their school coming by Car / Van (technical issues around data collection from all schools not withstanding).
So what to do now with this STHC School Pack and the interactive STHC Data Portal?
1. Explore Them Within Your School Management Team - They are free to use and contain much useful information that can assist you with both the day-to-day, and strategic, management of the school. Also their interactive, geostatistical nature and local relevance ("Think Global, Act Local"), make them ideal teaching resources for many areas of the curriculum, such as numeracy, geography, health & well-being and citizenship.
2. Encourage Your Whole School Community To Use Them - Make sure they make it into the staffroom, the classroom, your School Travel Plan (STP) working group, your Board of Governors, your PTA and any other stakeholders with an interest in how far, from where, and by what means, pupils travel to your school. Why not put the STHC School Pack resources up on the school & staffroom notice boards for starters?
Note: All online resources are publicly accessible but, given the perceived sensitivity around the use of postcode data, schools must log-in to the portal to see pupil icons on maps, otherwise pupils are shown as anonymised "heatmaps" (log-in account details for your school are provided in the accompanying STHC Data Portal Quick Start Guide, as well as from the local contacts listed below). Similar sensitivities may be associated with the paper Pupil Travel Maps in this pack. Management Teams should have a common sense approach to sharing what is, after all, their data!
3. Initiate / Continue An Informed Debate Around The Issues Of Active And Sustainable Travel In Your School Community - We all need to be more aware of the consequences of the travel choices we currently make, whilst thinking about what we would ideally choose to do. The "Questions For Debate (QfD)" in each of the resources will get the conversation started. Also the STHC analysis process generates short and long term Sustainable Travel indicators that let you quickly see where your school 'is at' right now (see Report):-
- If your score is Red or Amber: Don’t despair! We understand that the location or nature of your school may be a major factor in determining how your pupils travel to it. However this should not prevent your school having an informed debate to raise local awareness around the issues.
- If your score is Green: Before you open the champagne, the authority average is still well above where it needs to be to stop climate change! If we are all to live within the Earth’s carrying capacity we need to move from our current UK annual average of all CO2 emissions of 10 tonnes per person to 1 tonne.
4. Set SMART Targets For Change - Use the quantitative data in the STHC to set Specific, Measurable, Achievable, Realistic and Time-bound targets for change to aim for as a school community. For example:-
- Short Term: Reduce the number of pupils being driven from within the walking threshold. Why not run a "No Car Within Walk Threshold" challenge?
- Medium Term: Increase the distance pupils are prepared to walk or cycle to school - target those just beyond the current walking thresholds (those pupils outside of the circle on the STHC School Maps).
- Long Term: Consider how big an area your school draws pupils from. Should you be trying to draw more pupils from your local area or looking to provide more sustainable transport options?
Please don’t hesitate to contact the Transport Policy Team if you would like further assistance with the STHC and the issues surrounding travel to your school. We want it to be of as much use to you as possible – all ideas on how to improve it for the future are welcomed!
PS: If some of your figures / maps don’t look right - Your STHC relies on the School Census and Pupil Usual Mode Of Travel data you record in your School Information Management System being accurate, and us having the correct coordinates for your school. Please check the Pupil Travel Maps for rogue postcodes / modes of travel, and have any errors corrected in time for the next School Census / Pupil Usual Mode of Travel data return.
PPS: Split-Site Schools - If your school shares a common DfE number with other sites the STHC output will not reflect the true travel patterns of all your pupils. Please let us know if this applies to you.
This report summarises how far pupils are travelling to your school and by what means. It is based on spatial analysis of the School Census and Pupil Usual Mode of Travel data (if you have collected it), provided by your school to Dorset County Council in Spring 2017. Use it in conjunction with the rest of your STHC resources to debate and encourage active and sustainable travel to your school.
STHC Sustainable Travel Indicators - The STHC analysis process generates short and long term Sustainable Travel indicators that let you quickly assess where your school "is at" right now. Note: out of the pupils at your school (%) have no recorded mode of travel. If this number is high the STHC Sustainable Travel Red / Amber / Green Indicators calculated for the school will not be accurate as Unknown (UNK) modes of travel are treated as Car / Van for CO2 emissions purposes.
Living Within Walk Threshold ()
Travelling By Car / Van
Short Term STHC Sustainable Travel Indicator for =
out of the pupils that attend your school and live within a realistic walking distance (the "Walk Threshold") of it, still travel by Car / Van.Red: >30 Pupils Amber: 10-30 Pupils Green: <10 Pupils
Rank: amongst all schools
Rank: amongst schools
Annual Travel CO2 Emissions Per Pupil
Against Authority Average
Long Term STHC Sustainable Travel Indicator for =
Kg CO2 Per Pupil against an Authority Average of Kg CO2 Per PupilRed: >10% Above Average Amber: Within 10% of Average Green: >10 Below Average
Rank: amongst all schools
Rank: amongst schools
About The School Travel Health Check (www.sthc.co.uk) Since 2007-08 the STHC has provided all stakeholders interested in how far, from where, and by what means pupils are travelling to schools in , with high quality, spatial analysis resources that quantify and visualise the actual travel situation down to individual school level. These enable:-
- school communities to have an informed debate around the issues of active and sustainable travel and help them to set SMART targets for positive change.
- interested professionals to constructively engage with all schools in the authority, even if they don't have a travel plan, and assist the realisation of desired positive change.
- local authorities to have a strategic overview to target their limited resources to achieve modeshift.
Further assistance with the STHC and the issues surrounding travel to your school is available from the online STHC Data Portal (www.sthc.co.uk/portals/dorset) and the DCC Transport Policy Team:-
Questions For Debate
- Sustainable Travel Indicators - What do the STHC indicators tell you about travel to your school? Are they a fair assessment of where your school 'is at'? If not, what "Key Performance Indicators (KPIs)" do you think should be measured instead?
- Pupils Within Walk Threshold - Why do some pupils that live within a reasonable walking / cycling distance of your school still travel by car? How could they be persuaded to switch?
- Travel Distances - What is the total / average distance travelled by each mode to your school? Are these 'reasonable'? What can be done to encourage walking & cycling from a bit further away?
- Onward Travel - Of the parents that drive their children to school, how many travel onwards to work and how many go straight back home?
- Carbon Budget - How much of your school carbon budget is used up by school travel?
- Targets For Change - What SMART targets should / could you set for encouraging more active / sustainable travel to your school?
- Preferred Travel Modes - How would pupils prefer to travel to school (recording this should be part of your School Travel Plan)? What are the barriers that prevent them from doing so?
This section contains information about your school to help put the STHC analysis results into context. The Pupil Location Map shows the distribution of pupils as anonomised 'hotspots' along with the walk threshold for your school type. The interactive version on the STHC portal also shows pupils by mode of travel icon.
We know how pupils travel to your school from the Pupil Usual Mode Of Travel data you collect in your schools' information management system. If your school did not submit any data to your local authority in , the STHC Sustainable Travel Red / Amber / Green Indicators we have calculated will not be accurate as Unknown (UNK) modes of travel are treated as Car / Van for CO2 emissions purposes. The "Top 4" pupil usual modes of travel in your school are highlighted below (headline stats for all modes are shown in your STHC Portal). The bar charts & line graphs show all modes alongside those for as a whole by way of comparison.
out of the Total pupil journeys either to or from your school (%) have no recorded mode of travel. (LA = %)
Pupils %
LA = %
Pupils %
Whole LA = %
Pupils %
LA = %
Pupils %
LA = %
Pupils %
LA = %
Pupils %
LA = %
Pupils %
LA = %
Pupils %
LA = %
The starting point of our spatial analysis is to calculate the straight-line ("as the crow flies") distance between the centre of a pupils home postcode area and the actual school they attend. We call this the "Pupil Home – 'Actual' School Distance", or just "'Actual' Distance" for short. It represents the length of a single pupil journey from either home to school or back again. From these basic measurements we calculate both the total and average distances travelled, for each travel mode if possible. The results for the "Top 4" pupil usual modes of travel in your school are highlighted below, alongside those for as a whole by way of comparison.
= Total pupil journeys either to or from your school each day (LA = pupil journeys).
km = Total distance collectively travelled on each journey (LA = km).
km = Overall average distance travelled by each pupil (LA = km).
![]() Walking (WLK)
Walking (WLK)
LA = %
Total Distance
= km %
LA = %
Average Distance
= km
LA = km
Pupils %
LA = %
Total Distance
= km %
LA = %
Average Distance
= km
LA = km
Pupils %
LA = %
Total Distance
= km %
LA = %
Average Distance
= km
LA = km
Pupils %
LA = %
Total Distance
= km %
LA = %
Average Distance
= km
LA = km
Pupils %
LA = %
Total Distance
= km %
LA = %
Average Distance
= km
LA = km
Pupils %
LA = %
Total Distance
= km %
LA = %
Average Distance
= km
LA = km
Pupils %
LA = %
Total Distance
= km %
LA = %
Average Distance
= km
LA = km
Pupils %
LA = %
Total Distance
= km %
LA = %
Average Distance
= km
LA = km
Note the differences in the proportion of pupils travelling by each mode versus the proportion of total distances they have collectively travelled. For example in the whole of % of pupils walk to school, but they account for only % of the km total distance collectively travelled on each leg of the school run.
Also note the difference between the average distances travelled for each mode. For example in as a whole the average length journey by Public Service Bus (PSB) was km, whilst by Car / Van (CAR) it was km. QfD: How do the average journeys for your school differ?
Even if you did not submit Pupil Usual Mode of Travel data, the STHC still provides useful information. QfD: How does the average length of pupil journey to your school compare to that for as a whole?
The Walk Threshold is the distance within which most pupils should reasonably be able to walk school. We have defined it as 800m (0.5 miles) for Primary pupils and 2km (1.2 miles) for Secondary pupils, which is based on the straight line distance the majority (85%) of pupils have been found to actually walk. Thus from the Actual Distance figures calculated for each pupil, we can determine which live within a realistic walking distance of the school they actually attend. If we have mode of travel data, we can also calculate which of those pupils are travelling by other modes, in particular by Car / Van.
NOTE: 'Middle' and 'Special' schools cover both 'Primary' and 'Secondary' age ranges. Though both walk thresholds are shown on the maps, only the relevant one for an individual pupils age is used in the “within walk threshold” calculations.
Living Within Walk Threshold ()
out of the pupils
Rank: amongst all schools
Rank: amongst schools
Living Within Walk Threshold ()
Travelling By Car / Van
Short Term STHC Sustainable Travel Indicator for =
out of the pupils that attend your school and live within a realistic walking distance (the "Walk Threshold") of it, still travel by Car / Van.Red: >30 Pupils Amber: 10-30 Pupils Green: <10 Pupils
Rank: amongst all schools
Rank: amongst schools
The number of Pupils Living Within Walk Threshold indicates how well the school is located with respect to its pupils (and vice versa!). Several factors are involved in this - the 'rurality' of the school, how far pupils are willing to travel to get to it (by whatever means) etc. From a sustainable travel point of view, there is little a school can do to change this metric if its' physical location means that there are few pupils (actual or potential) living nearby. Such situations are becoming more common as schools merge and a new campus is built on a new site.
What a school can do something about is influencing how the pupils that do live within a realistic walking distance travel to it. We call this a short term indicator as it is something that can be immediately tackled by the school if it chooses to do so with the help of the school travel professionals - awareness raising campaigns like Walk Once a Week (WOW), "Park & Stride" schemes, better cycling / pedestrian infrastructure etc. It is a concept that everybody can understand ("why are they not walking when it's such a short distance?"), and therefore buy into the idea of tackling. It is also something that can be easily and consistently measured so if the number decreases over time, it indicates that progress is being made in tackling the issue.
When we have Pupil Usual Mode of Travel data, we can convert the "Pupil Home – 'Actual' School Distance" into CO2 emissions for those modes of travel involving motorised transport by using the official UK government Greenhouse Gas Conversion Factors. Please refer to the "Factors" page in the Analysis Section of the main STHC website (http://sthc.co.uk/?col=2&tab=4), or your portal, for details about CO2 calculations.
Note: Unknown (UNK) modes of travel are treated as Car / Van for CO2 emissions purposes.
out of total pupil journeys (%) either to or from your school involve "motorised transport" (LA = %).
kg total CO2 is emitted on those pupil journeys either to or from your school each day.
kg total CO2 is emitted on all pupil journeys to and from your school each year (we assume a school year of 190 teaching days to calculate annual totals).
Note: ("Motorised Tansport" is any of the following modes - CAR, CRS, PSB, DSB, BNK, TXI, TRN, or MTL).
Total annual CO2 emissions do not tell the whole story. In order to be able to meaningfully compare the school travel carbon footprint for your school with any other school, we need to calculate an overall annual average CO2 emission per pupil for all pupils at the school (ie. not just those that travel by CO2 emitting modes). That way we can compare "apples with apples". To that end we have devised an STHC Sustainable Travel indicator by comparing the "per head" CO2 emission with the authority average. The indicator is a simple traffic light value (Red, Amber or Green) depending on how the figure compares with the authority average.
Annual Travel CO2 Emissions Per Pupil
Against Authority Average
Long Term STHC Sustainable Travel Indicator for =
Kg CO2 Per Pupil against an Authority Average of Kg CO2 Per PupilRed: >10% Above Average Amber: Within 10% of Average Green: >10 Below Average
Rank: amongst all schools
Rank: amongst schools
Reminder: out of the Total pupil journeys either to or from your school (%) have no recorded mode of travel.
(LA = %)
CO2 emissions are very much a longer term sustainable school travel indicator because, although the concept is fairly easy to understand - the further you drive the more CO2 is produced - tackling the issue is not so straight forward. All forms of motorised travel emit CO2. Yes some more than others theoretically on a per passenger basis, but a high proportion of pupils travelling by bus from a long distance away will produce a similar overall annual average CO2 per pupil as a few coming by car from not very far away and the rest walking.
Reducing total CO2 emissions will require sustained action by the school community over a longer period of time, supported by continued STHC analysis resources.
The health and academic benefits of walking and cycling to school are well known so we have calculated the "calorie footprint" of the school:-
out of total pupil journeys (%) either to or from your school involve non-motorised transport (ie. WLK or CYC) (LA = %).
calories burned during those pupil journeys either to or from your school.
calories burned during all pupil journeys either to or from your school each year.
Annual Travel Calories Burned Per
Pupil Against Authority Average
Rank: amongst all schools
Rank: amongst schools
As with the CO2 emission we have calculated the average calories burned per pupil for all pupils at the school (ie. not just those that travel by walking and cycling) so we can compare "apples with apples". However we have not converted this into a traffic light indicator. Again see the "Factors" page in the Analysis Section of the main STHC website (http://sthc.co.uk/?col=2&tab=4) for details about calorie calculations.
Another approach to reducing carbon footprints is to reduce the total distance travelled by pupils. As we can't change where the pupils live, lets look at the school they actually attend - is it the nearest one they could possibly go to (given their national curriculum year group)? If not, what is, and how much "extra" distance are they travelling?
Attending Their Nearest Eligible School
out of Pupils
Rank: amongst all schools
Rank: amongst schools
These questions are easily answered by the STHC as the analysis process routinely deduces a pupils nearest school and the distance to it, and compares that with the actual school they attend. This long term STHC Sustainable Travel indicator is explored in much more detail in the STHC Data Portal.
Proximity & Pupil Choice Analysis Module [BETA]
Pupils Attending Their Nearest School is again a very much longer term sustainable school travel indicator. The concept is fairly easy to understand - if pupils went to their nearest school then they wouldn't travel as far so there will be less CO2 produced - but there is much more to it than just school travel distance. Viewed from the schools perspective this indicator quantifies the "attractiveness" of the school amongst the pupils that attend it. The bigger "the draw" of the school, the further parents will be willing to travel and the fewer the pupils for whom the school is their nearest. We have not put rated the indicator values against a traffic light system as there is no simple target to aim for. What would your school suggest?