Welcome to the School Travel Health Check (STHC)
Since 2004 the STHC Analysis Service has been continually developed in conjunction with local authorities, school communities and other stakeholders interested in how children travel to school, from where, and how far they travel to get there.
The STHC provides local & national stakeholders with high quality, spatial intelligence data that:-
- quantifies and visualises the pupil travel situation for all schools at both a collective and individual level, over a prolonged period of time, in a consistent way.
- enables informed debate about the issues around active & sustainable travel based on the actual situation rather than speculative presumption and tabloid style, “knee-jerk” reactions.
- enables officers to engage simultaneously with all authority schools at an operational level in a consistent, meaningful & constructive way (whether or not they actually collect pupil usual mode of travel or have a travel plan), using their own data.
- ensures better targeting of limited public resources to schools where behaviour-changing shift to more active and sustainable modes of travel on the "school run" is more achievable.
- provides a robust evidence base to inform joint-working and strategic planning & funding of supporting services & infrastructure.
Click & expand the sections below to find out more, or dive straight in to our demonstration STHC Data Portal...
If we want to get rates of cycling and walking up to the levels of the best European communities we need to use this data to make sure our transport plans will make that happen. If we fail to take maximum advantage of this opportunity, we may fail our children.”
Dr Gabriel Scally Regional Director of Public Health for the South West
 In a single sentence, the School Travel Health Check service supports local authoritiy professionals and school communities who are trying to achieve modeshift to more active and sustainable modes of travel on the "school run".
The STHC does this by first undertaking spatial analysis of local authority pupil-level and school-level School Census data, and Pupil Usual Mode of Travel data (if available). We use Geographic Information System (GIS) software and other standerd tools in an analysis process specifically developed and honed by us over the last 12 years. We then make the analysis results available to all stakeholders as a suite of digital resources on an online, publicly accessible, interactive, map-enabled data portal. This is supplemented by a suite of supporting digital files (such as GIS files), supplied directly to the client.
Digital output is further supported by STHC paper map packs sent to all schools, containing a bespoke analysis report, large format (A1 sized), maps centred on the school and a key results table of all schools in the authority.
A comprehensive overview of all aspects of the STHC is provided in the “STHC Guide Document 1: Overview”, available from the link in the panel below, or the Downloads & Resources section.
 STHC Guide 1 - Overview (v3.6, July 2013)
This guide gives an overview of the STHC – the input data required from client authorities, the basic analysis process, what exactly they get back as standard output and what they may want to commission as an additional service, the benefits it will bring them, who else is doing it already, how much it will cost them and the delivery timescales for them receiving their analysis data. Finally there is some discussion about data protection issues. This guide should be freely distributed to colleagues, managers and potential partners as part of the internal awareness raising process.
Click here to download the STHC Guide 1 - Overview document (.pdf, 1.4 MB).
Sharon Payne
East of England Regional School Travel Adviser, DfE & DfT and Sustainable School Travel Strategy Officer, Suffolk County Council
As ex-local government & Sustrans officers ourselves we know:-
- what information tools are needed in order to actually make a difference at an individual school level, because that's where behaviour change needs to happen - think global, act local after all!
- it's hard enough as it is to affect social behaviour change in society, but it is even more difficult if you lack the necessary business-critical intelligence to tell you what's actually happening on the ground and where.
- it's hard enough as it is to provide a public service as a local government professional in this time of severe cut-backs, but we also know that it is even harder if you lack the robust evidence base that demonstrates to those allocating the budgets that what you are doing is making a real difference on the ground.
We have therefore continually developed and honed the STHC process over the last 10 years so that it:-
- quantifies and visualises where every pupil is travelling from and how far for each school, and therefore where the limited resources should be targeted to give a "fighting chance" of achieving modeshift.
- provides both the "big picture" required at the strategic planning level whilst still being detailed enough to enable resource targetting at the operational level.
- is of use to a wide range of local authority professional service providers - local transport planners, school admissions planners, school transport managers, sustainable travel coordinators, school estate planners & managers, child health professionals etc. - and so can enable effective joint working as all will be "singing from the same hymn sheet".
- is of use to both school management teams and teaching staff.
- will provide the robust evidence base to show what is changing at a local level if our spatial analysis is repeated every year.
The STHC can do all this because only spatial analysis provides the business-critical intelligence insight that is required, and this cannot ever be gained from simple "head counts" of pupils by hands up surveys or whatever on their own.
Emma Sheridan
Former London Regional School Travel Adviser for DfE & DfT and School Travel Manager, Transport for London and Modeshift Chair
First and foremost the STHC represents outstanding return on a very modest investment as exactly the same suite of STHC digital output can be used:-
- by the many different stakeholders with an interest in achieving modeshift to more active and sustainable modes of travel on the "school run" - professionals (local transport planners, school transport managers, sustainable travel coordinators, school estate planners & managers, child health professionals etc.), as well as the individual school communities (management teams, teachers, pupils, parents etc.).
- at a strategic level as an evidence base to inform future planning of services & infrastructure (eg. Sustainable Modes Of Travel Strategies SMOTS). Also by raising the profile of their work internally and externally with colleagues, managers and other stakeholders, potential joint working and funding opportunities may be identified.
- at an operational level to inform day-to-day targeting, prioritising & scheduling of professional resources, as well as providing those professionals with a tangible means of engaging with all schools in their LEA in a consistent and regular way that is both meaningful and constructive.
- as a starting point for further, more detailed analysis (spatial or otherwise) at the local level using in-house skills & resources.
By carrying out the analysis in exactly the same way for every pupil, in every school, in every client authority and adding in the spatial dimension, the STHC makes it possible for all interested parties to:-
- gain business-critical insight into the actual school travel situation on the ground that can only be derived by spatial analysis at individual pupil level in a way that simple "head counts" of pupils by mode will never be able to do.
- easily visualise and quantify the current school travel situation, for all schools at both a collective and individual level, over a prolonged period of time, in a consistent way, using interactive, online resources to get the perspective on it they need.
- engage simultaneously with all schools in the authority in a consistent, meaningful and constructive way (whether or not they actually collect pupil usual mode of travel or have a travel plan), using their own data.
- always compare "apples with apples" - whether these "apples" be age ranges, socio-demographics attributes, or the geographic location of both the schools and the pupils that may (or may not!) attend them. This is due to the straightforward nature of the spatial analysis - "as-the-crow-flies" - and the fact that we have results at an individual pupil level which can then be aggregated by any criteria required.
The main purpose of all this analysis however is not just to be clever for the sake of it, but to provide local authorities and school communities with quantitative, spatial intelligence data that will allow them to actually do something about making things better (think global, act local). The STHC analysis output gives them the ability to:-
- debate the issues around sustainable travel within the school community in a way informed by quantitative analysis of their own data rather than speculative presumption and tabloid style, “knee-jerk” reactions.
- arrive at their own assessment of the overall scale of the “school run” problem when compared with other LEAs or schools.
- identify where action needs to be taken, and then target resources and initiatives to those schools where they the most likely to achieve the best return for the limited available resource..
- set targets, ideally SMART* oness (*Sustainable, Measurable, Achievable, Realistic and Time-bound), for those initiatives to deliver in the short, medium and longer term:-
- short term quick wins include running awareness campaigns in schools identified as having the most number of pupils coming by car from within the walk threshold, to highlight the merits of walking or cycling.
- medium term outcomes could be identifying where pupils from a further distance could most easily be persuaded to walk or cycle in the future, perhaps once physical infrastructure has been put in place (eg. a footbridge bridge over a railway line or other barrier may suddenly make cycling / walking a viable option for pupils in a particular location that otherwise have to go by car due to the current journey distance / time).
- longer term outcomes could be assessing how well schools are currently situated to serve the current distribution of pupils, and where strategic changes could be made to reduce the overall total “pupil miles” travelled in the LEA.
- Benchmark and monitor how well these targets are being met. This will give an indication of how effectively initiatives are working to change things on the ground and may well unlock further funding to carry on the good work.
- If the analysis of the annual census data is repeated each year, clients will build up a robust evidence base to inform future strategy and funding.
See the main Purpose & Benefits section for more specific benefits of the STHC in the areas of Individual Schools, Sustainable Travel, Active Travel, SMART Target Setting, Transport Planning and Road Safety.
See the main Clients, Testimonials & Citations section for a map of STHC client authorities, their numerous testimonials about the STHC, and a list of citations of the STHC as an example of best practice in the sustainable / active literature.
Albert Ward
School Travel Plan Team leader, Somerset County Council
The price of the STHC Service for a single census years data processing is set by our transparent pricing formula - £1,500 per LEA + £12 per school + £0.01 per pupil (exc. VAT) - with STHC School Packs costing an additional £26-28 per school depending on delivery options (either by clients themselves via their own internal post or directly by us). Thus client authorities will always know in advance how much our service is going to cost.
Client authorities are free to repeat the analysis the following year or not (although we would strongly recommend that they do). If they don't, there is a 10% annual charge based on the pricing formula for continued hosting of their portal and to remain part of the "STHC Club".
Our aim is to continually improve our service by encouraging feedback from client authorities and incorporating their suggestions into subsequent output wherever possible. All authorities that remain part of the "STHC Club" will be assured of automatically benefiting from these future improvements at no additional cost.
See the main Commissioning, Cost & Delivery section for more information about commisioning the STHC, our transparent pricing formula so you always know the cost of the STHC in advasnce, and the delivery mechanisms & timescales for the various STHC output components.
Kevin Speakman
School Travel Plans and SMOTS, North Somerset Council
![]() The STHC service is managed and delivered by Knowledge Mappers Ltd., a small but dedicated consultancy company (along with a network of associates) made up of ex-local authority and Sustrans officers with over 70 collective man-years of experience in the fields of spatial analysis, environmental science, local authority data and delivering sustainable travel solutions. All are committed to delivering lasting change in the field of active & sustainable travel.
The STHC service is managed and delivered by Knowledge Mappers Ltd., a small but dedicated consultancy company (along with a network of associates) made up of ex-local authority and Sustrans officers with over 70 collective man-years of experience in the fields of spatial analysis, environmental science, local authority data and delivering sustainable travel solutions. All are committed to delivering lasting change in the field of active & sustainable travel.
Knowledge Mappers is registered with the UK Information Commissioner (our registration number is Z1303712).
 See STHC co-founder and Knowledge Mappers founder and CEO Angus McDonalds profile on LinkedIn.
 See STHC co-founder and Andrew Combes & Associates founder and CEO Andrew Combes profile on LinkedIn
This section sumarises what datasets we require from our client authorities and how they fit into our analysis process:-
Note a comprehensive list of what data fields we require as well as the reasons why we ask for them, are also contained in “STHC Guide Document 2: Client Input Data”, available from the link in the panel below, or the Downloads & Resources section. If there are any queries or concerns around the Client Input Data we require then don’t hesitate to get in touch with us directly.
 STHC Guide 2 - Client Input Data (v3.3, July 2013)
This guide describes in more detail the datasets client authorities need to supply to us (the “Client Input Data”) in order for us to undertake the School Travel Health Check. It has been produced to tell client officers what datasets we require, how they fit into our analysis process and whom they need to contact within their authority to get hold of them. However it has also been designed to be read by Data Holders to inform them why this data is being requested from them by the officer and what they need to supply at a technical level (they need only read the sections about the datasets they are concerned with!).
Click here to download the STHC Guide 2 - Client Input Data document (.pdf, 1.4 MB).
This is an extract of the data about individual pupils that is recorded by the school on its information management system and collected as part of the official National School Census by the local education authority on behalf of central government.
 We require "Pupil-Level" School Census Data so that we know:-
- unambiguously who they are (using their authority / national pupil identifier, not any personal data like name etc.), so the data can be unambiguously cross referenced with pupil mode of travel data (if available) for analysis, and the resulting data can be unambiguously cross-referenced with other pupil-level data the authority holds.
- where they are travelling from (using their home postcode centroid, not their actual address), so we can plot their home location on a map reasonably accurately and undertake our spatial analysis process.
- essential qualifying facts about them, crucially how old they are (using their National Curriculum Year year group, not their date of birth), so we know what schools they could also go to.
- other useful facts about them (practical things like socio-demographic data - gender, ethnicity, free school meal entitlement, Index of Mass Deprivation (IMD), etc.), so we can analyse and split the data in different ways to figure out if any of these factors influence the observed pupil travel behaviour.
We therefore require the following data fields for each pupil in the "Pupil-Level" School Census Data extract supplied to us (see section 2.4 of STHC Guide 2 - Client Input Data for a full discussion about each):-
- Unique Identifier
- LEA Code
- Home Postcode
- Actual School DfE Establishment Number
- National Curriculum Year (NCY)
- Gender
- Free School Meal Entitlement
- Ethnicity Code
This is the data about how individual pupils usually travel to school. In England between 2005 and 2011 it was recorded by schools on thier information management system and collected as part of the official National School Census by the local education authority on behalf of central government. Since the English Department for Education unilaterally decided to stop collecting it as part of the national census in 2011, it has been up to each local authority, and individual school in the case of academies, as to whether or not to continue collecting the data from pupils and how it is recorded.
- Before We Begin, A Word Of About Individual Pupil Usual Mode Of Travel Data
- Why We Need It
- What We Need
On the 29th July 2011 the English Department for Education announced that, in order to “reduce bureaucracy”, Pupil Usual Mode of Travel had been immediately dropped as a data field from the English National School Census (see the full story in this part of the website). Although they couldn't stop schools and local authorities from still collecting the data (and there is no technical reason why they can't as the Mode Of Travel data field remains an operational field in schools information management system software), many took this as a their cue and stopped doing so.
However despite the resultant increase in bureaucracy to themselves, many authorities have made the necessary, alternative arrangements to collect pupil mode of travel data directly from all their schools on an individual basis, academies as well as ones still under their control. They have done this because they appreciate the value of continuing to have an authority-wide view of how pupils travel to school for transport planning and many other purposes.
We therefore continue to offer the School Travel Health Check Service to all UK local authorities. Indeed as is our custom we have adapted and improved the robustness of the STHC process:-
- Lack of Pupil Usual Mode of Travel Data from some / all schools in an authority does not prevent us undertaking spatial analysis of the "Pupil-Level" School Census Data (and never has done). All we need to do that is the pupils home postcode, and that will always be collected as part of the School Census.
- This means we can still plot all pupils on a map, and therefore all schools can still visualise where all their pupils are travelling from on the School Map & Charts page on the authorities STHC data Portal. It has always been the case with the STHC that pupils with no recorded mode of travel have been coded as "Unknown (UNK)", and assigned the "Unknown" symbol on the map.
- This means authorities can still engage simultaneously with all the schools in "their patch" in a consistent, meaningful and constructive way using their own data, irrespective of whether or not they still collect pupil mode of travel data or have a school travel plan.
- Although the resulting analysis output is less rich without the results being broken down by individual pupil mode of travel, it still contains much useful information of value to local authorities that can be used to profile the pupil travel situation in individual schools eg. total and average "actual" travel distance.Thus authorities will still be able to identify the ones where active engagement would potentially yield the best results.
- That said we can easily "plug in" alternative sources of pupil travel mode data if they are available, even if it is only at whole school-level rather than individual pupil level. For example the Sustrans Hands Up Survey in Scotland or the ModeShift Stars Survey in the rest of the UK. Although not ideal and a bit of a "half-way house", these can still be "mashed up" with the pupil maps obtained by spatial analysis of the "Pupil-Level" School Census Data in the portal for great visualisation and at least some quantification.
Thus whilst not exactly "business as usual", the STHC is still here for those local authorities that appreciate the value of having an authority-wide view of how pupils travel to school. We do appreciate however that during the transition process between collecting regimes, the situation within an authority may be patchy and confused. All we ask is that, when providing their Input Data to us, clients are clear about its completeness and let us know what schools (if any) are missing from it. This will save any unnecessary delay in processing due to data failing initial quality control checks!
 STHC Briefing Paper On The Sudden Announcement By DfE That The Pupil’s Usual Mode Of Travel Field Is No Longer To Be Collected As Part Of The School Census (2nd August 2011)
This paper contains the “facts” of the matter around the announcement as far as could be gleaned from the DfE website at the time, and was the basis for the ModeShift briefing paper sent round the school travel community. The hope was that it contained enough background information, direct quotes and points of contact to enable all the stakeholders who currently benefit from the collection of mode of travel data through National School Census to successfully engage with officials within DfE, and the relevant Minister For Schools (one Nick Gibb, MP for Bognor Regis in West Sussex), to get this decision reversed.
According to DfE officials these changes were all happening at the insistence of the minister, which presumably is why they had been implemented unilaterally, without any exteranl consultation with the local authority active and sustainable travel community, and against long established departmental procedures controlling changes to the contents of the School Census (ie. the so called "Star Chamber Scrutiny Board").
Click here to download the STHC Briefing Paper document (.pdf, 0.1 MB).
 As already discussed it is not essentiasl for us to have been supplied with Pupil Usual Mode of Travel data in order to undertake the STHC spatial analysis process. However the analysis results will be "less rich" without it, and it may affect what it can be subsequently used used for by the client.
Click on the image on the right to see pages from the STHC data portal side by side, the ones on the left are for a school that doesn't collect mode of travel data, the one on the right does. We leave it up to individual schools and local authorities to decide if the extra effort of collecting usual mode of travel data at individual pupil level such that it can be spatially analysed (ie. s cross-referenced with the pupils home postcode), is worth the extra effort on their part.
Given the patchy and chaotic situation around the collection of pupil usual mode of travel data from schools, even within a single local authority, the simplest approach is for us just to say to clients "tell us what you have got and we'll take it from there".
The Pupil Usual Mode of Travel data values currently reported in the STHC output are those that were defined by the Department for Education when it was collected as part of the National School Census from 2006 - 2011. These are summarised in the table below:-
| Mode of Travel | STHC Code | STHC Symbol |
|---|---|---|
| Walk | WLK | Cycle | CYC | Car or Van | CAR | Car Share | CRS | Public Service Bus | PSB | Dedicated School Bus | DSB | Bus Type Not Known | BNK | Taxi | TXI | Train | TRN | Metro / Tram / Light Rail | MTL | London Underground | LUL | Other | OTH | Unknown | UNK |
These are (and have always been in our humble opinion :-) deficient in several ways:-
- They are too London-centric (eg. there are separate codes for "Metro/Light Rail" (MTL), "London Underground" (LUL) and "National Rail" (TRN)), and do not fully reflect the mix of travel modes used by pupils across the country - for example there are no codes for travelling by "Scooter" or "Ferry".
- There are also no codes for "Park & Stride" or "Ride & Stride", which means that the data cannot track positive changes in travel habits happening within a school after such enabling intervention schemes have been put in place.
However they were at least a national standard at one point so if that is what you are still collecting, then of course we will be happy to use it. Please just make sure that the data you send us contains the pupil UPRN so we can cross-reference it with your "Pupil-Level" School Census data.
If on the other hand you have already switched to alternative data schemes such as the Modeshift STARS scheme, or you are a Scottish local authority and you participate in the Sustrans Hands Up Survey in Scotland, we will also be happy to adapt the STHC to the revised modes of travel used in those surveys. However remember these surveys only collect data at school-level, so there is a compromise as to how data can be shown on the portal.
This is an extract of the data about individual pupils that is recorded by the school on its information management system and collected as part of the official National School Census by the local education authority on behalf of central government.
 We require "School-Level" School Census & Gazetteer Data so that we know:-
- unambiguously which school they are (using the official DfE Establishment Number (or equivelant), not just the name), so the analysis results can be unambiguously cross-referenced with other data about the school.
- where the school is located (using the Ordnance Survey grid reference, not just the postal address), so we can unambiguously and very accurately plot their position on a map and measure pupil travel distances to it during our spatial analysis process.
- essential qualifying facts about them (crucially what type of school they are and crucially what age range of pupils they accept), so we know if any given pupil is eligible to attend them during our spatial analysis process.
- other useful facts about them (practical things like contact details, websites etc. and some socio-demographic stuff), so we can incorporate it into our analysis output data for the benefit of the end user.
We therefore require the following data fields for each school in the "School-Level" School Census Data extract supplied to us (see section 3.4 of STHC Guide 2 - Client Input Data for a full discussion about each):-
- School Name
- LEA Code
- DfE Establishment Number
- School Type (DfE Census School Type Code and/or LEA-Specific School Type)
- School Phase of Education (PoE)
- National Curriculum Year (NCY) Range (Minimum NCY Year Group and Maximum NCY Year Group in separate fields)
- Ordnance Survey Grid Reference (Easting & Northing in separate fields - see above)
- School Postal Address
- School Telephone Number
- School Email Address
- School Website Address
- Intake Type
- Free School Meals Taken
- Number of Full Time Equivalent (FTE) Staff
- LEA-specific Unique School ID (if routinely used)
At the very least the “School Gazetteer” file sent to us must be the official, definitive list of all the schools in the LEA along with their accurate Ordnance Survey grid references:-
- By “official” and “definitive” we mean supplied and maintained by (or on behalf of) the LEA administration / information team. This means that if a school is closed / merged / relocated / newly opened etc. this file is automatically updated (including the grid references).
- By “accurate” we mean the grid reference falls within the boundaries of the main school building. In technical “GIS-Speak” it needs to be of AddressPoint standard – your GIS team will know the answer to this. We can assess the suitability of your school gazetteer file if you have any doubts.
PLEASE MAKE SURE THAT THE GRID REFERENCES CONTAINED IN THE SCHOOL GAZETTEER FILE YOU SUPPLY TO US ARE CURRENT AND ACCURATE – In particular ensure that for any schools that have been merged & relocated, or are new builds, that the grid references have been updated accordingly. Whilst we make every effort to look out for potential sources of errors and inaccuracies as we are going along, we are not responsible for the accuracy of any of the grid references supplied to us. We can quality check your data before processing and carry out any remedial corrections of the grid references as an Additional Service if required.
![]() The Ordnance Survey (OS) supplies UK local authorities with various topographic mapping and other geospatial datatsets under 2 public sector mapping agreements:-
The Ordnance Survey (OS) supplies UK local authorities with various topographic mapping and other geospatial datatsets under 2 public sector mapping agreements:-
- Public Sector Mapping Agreement (PSMA) - England and Wales
- One Scotland Mapping Agreement (OSMA) - Scotland
Thus there is no additional cost to local authorities for us using Ordnance Survey data on their behalf.
 We require various Ordnance Survey datasets in order to:-
- geocode (ie. assign a grid reference to) the "Pupil-Level" School Census Data.
- perform spatial analysis on the Client Input data using GIS software.
- provide background mapping for our STHC Pupil Travel Maps, which are created as part of the STHC School Pack.
The good news is that as we are now part of the Ordnance Surveys Multi-Client Contractors Scheme, which means that they automatically supply us with national coverage of all the OS datasets we need. Thus local authority clients no longer need to physically send us their Ordnance Survey data.
For reference the OS datasets we use include:-
- CodePoint - contains the grid references of the centroid of each unit postcode in the UK, as well useful “look-up” information about them such as which local authority, NHS area, parliamentary constituency etc. they are in.
- BoundaryLine - contains the definitive administrative and political boundaries for Great Britain down to electoral ward level.
- OS Topographic (Base) Mapping – Various scales are required as background imagery on any results maps we produce such as those in the STHC School Packs:-
- OS 1:10,000 Colour raster
- OS 1:50,000 Colour raster
- OS 1:250,000 Colour raster
The bad news (well not that bad) is that we will still need to sign a Contractors Agreement issued by your authority in order to use the OS data we have on your behalf. However the good news here is that it is a standard contract document and it should be readily available from your Authority Liaison Officer (ALO), the person responsible for managing the digital map data supplied to the authority under the Public Service Mapping Agreement (PSMA) (and incidentally a very useful person to know anyway if you are undertaking any sort of mapping work). This can be emailed to us to sign and email (or post) back to you by return.
The even better news is that this only needs to be done once, the first year we undertake the STHC analysis. Thus after the initial set up process, clients do not need to do anything else with regards to supplying us with Ordnance Survey datasets so this administrative requirement needn’t delay any other aspect of the processing.
This is the high quality aerial imagery that local authorities usually commission for "thier patch" every few years or so. Aerial photography is usually covered by a separate, unrelated license agreement to that for the Ordnance Survey mapping data as it will have been supplied by a specialist aerial imagery company, such as GetMapping or BlueSky. Thus we can only get it direct from the authority.
 We require Digital Aerial Photography data if it’s available (and it is in the case of most local authorities), to use as background mapping for our Pupil Travel Maps that form part of our STHC School Packs.
We need the latest available digital aerial photography files for the authority. Note however that, due to the expense, authority-wide aerial photography is usually only commissioned / acquired every few years. For example it may be tied in with National Census collection ie. 1991, 2001, 2011 etc. Thus even the most recently acquired imagery may not show newly built features that are on the Ordnance Survey map. We can only use what you’ve got, but as long as users are made aware of the date the imagery was taken they can make allowances for this!
In terms of internal contacts, there are usually 2 ports of call for any mapping / aerial photography requirements within an authority, depending on the internal digital mapping / GIS setup:-
- Authority Liaison Officer (ALO) - This is the named officer in each local authority responsible for the receipt, management and internal distribution of all digital data supplied under the PSMA. Thus they are the ultimate source for the digital mapping data we require. Incidentally this is also true for everybody in the authority so, if you are new to the world of digital mapping and GIS, the ALO is a good person to speak to initially to find out who is doing what and therefore might be interested in the STHC analysis output. However how the ALO function is carried out varies greatly between authorities in terms of whom the person is, their technical experience, seniority and time available to devote to the role. This may mean that the actual day-to-day, hands-on management of the MSA data may be delegated elsewhere, which is where source #2 comes in.
- Authority GIS Team - If the authority has a dedicated, corporate GIS Team then they will probably be the people that actually give us the digital aerial photography files we require. Again they are worth making contact with anyway as they will probably be:-
- interested in the output analysis data we will eventually supply back to you.
- involved at a technical level in enabling Clients to visualise the GIS data we send them, either using the corporate GIS setup, perhaps via their intranet, or stand-alone software installed on their computer.
Note Due to the large size of the digital aerial photography files, especially for authority-wide coverage (we’re talking 100s of megabytes), we will need to sort out the logistics of obtaining the data directly with your GIS Team. Normally we would send them a portable hard drive for them to transfer the data onto and post back to us to save them the hassle of having to write it onto multiple data disks.
As the aerial photography is supplied under a different licensing agreement than the Ordnance Survey data, authorities must check that the terms and conditions of use enable them to supply us with the data in order to produce paper maps on their behalf. They will also need to supply us with the correct copyright acknowledgement statement to include on the paper maps we produce.
We take clients school census data and pupil usual mode of travel data (if available) and using standard spatial analysis tools, we work out where pupils have come from, how far they have travelled (using straight-line (“as the crow flies”) distance), and by what means to get to the school they actually attend, as well as the nearest school they could attend. Total and average distances can then be subsequently converted into carbon and calorie footprints for each mode of travel using standard factors. All this gives us a quantified snapshot of the current school travel situation in the client authority, which is reported down to individual school level.
In this section we describe in further detail the:-
The following form the foundation of our spatial analysis process. From these, all other things flow ...
The starting point of our spatial analysis is to calculate the straight-line (“as the crow flies”) distance between the centre of a pupils home postcode area and the actual school they attend. In the STHC Output this is called the “Pupil Home – 'Actual' School Distance” or just "'Actual' Distance" for short. This represents the length of a single pupil journey from either home to school or back again.
So why do we use the straight-line distance rather than the distance of the route actually travelled? Well for start we don't actually know the route that the pupil will take to school. Yes you could make a good guess for those coming by car as they are driving along the roads, but are they coming by the "quickest" route or the "shortest" route? And what happens if they "park and stride", ie. park at a designated car park near the school and walk the rest of the way? And what about those that car share and so may not take the direct route to the school? As for those coming by bus, how far do they actually travel along the road? And what about those that may not be using the road at all? Walking and cycling paths are often not part of a road network, in which case we do not have the basic data that will enable us plot the route and therefore measure the distances involved. No it is much better to keep the spatial analysis process as simple and transparent as possible and make it consistent irrespective of the mode of travel involved, that way we can always be sure of comparing "apples with apples". Further, more complex analysis can always be undertaken using the GIS data included in the STHC Output if clients are so minded.
Notes:
1. Unfeasibly Long Travel Distances - In the STHC Output we report both the minimum and the maximum "Pupil Home - 'Actual' School Distances" calculated. Unfeasibly long journeys for walking and cycling more than likely indicate miscoding of the original source data - either the pupil postcode and/or the mode of travel - rather than super human pupils! Looking on the positive side, such errors would not have come to light unless spatial analysis had been undertaken so it is a necessary step to improving data quality for the future. We therefore simply encourage schools in this situation to try and ensure that any errors are corrected in time for the next school census.
2. Zero Travel Distances - Very occasionally a minimum "Pupil Home - School Distance" of zero is reported. This is an unavoidable consequence of using the centre of the postcode unit for the pupil location rather than the pupils actual home address. If a school does not have it's own unique postcode - and many smaller primary schools don't - it will be shared with adjacent houses. Thus any pupils attending the school from those houses will be shown as having a travelling distance of zero!

From the Actual Distance figures calculated for each pupil, it is then possible to calculate which live within a realistic walking distance (the "Walk Threshold") of the school they actually attend.
Although this is a simple enough concept to grasp, there is unfortunately no standard definition of what a "realistic" or "reasonable" walking distance is. Thus since the beginning of the STHC we have defined our walk thresholds as 800m (0.5 miles) for Primary schools and 2 km (1.2 miles) for Secondary schools.
 As well as the distance to the school they actually go to, we also determine the distance to the nearest school that a pupil could possibly attend given their national curriculum year (NCY). This is called the "Pupil Home – 'Nearest' School Distance" or just "'Nearest' Distance" in the output. We also record the difference between the "Actual" and "Nearest" distances. Of course both the "Actual School" and "Nearest School" could be one and the same but both are recorded (and the distance to them) in our analysis data.
So why go to all the bother to work out the "Nearest Distance"? Well arguably the represents the "ideal world" scenario from a sustainable travel point of view - all pupils attending their nearest school means the minimum amount of travel for all. On a practical level as far as our analysis is concerned however, it gives us something to put the actual distances travelled by pupils into context. It puts a number to the reduction in overall "child miles" that is theoretically possible through "sustainable travel" measures alone given the current geographic distribution of schools and pupils (i.e. trying to change the travel choices made by the pupils rather than changing where they or the schools are). In other words it gives a quantifiable, and therefore directly comparable, measure of the current distribution of schools with respect to the pupils (or vice versa)!
Once spatial analysis has told us where all the pupils are coming from, how far and by what means they are travelling and where they are travelling to, we can calculate:-
- the total distance travelled to school and back by all pupils on a daily basis for all recorded modes.
- the average distance travelled by particular modes.
- the distance within which the "majority" of pupils live from their school. (Rather than simply being "more than half", traffic and transport engineers strictly define the "majority" as the 85th percentile ie. the distance within which 85% of the pupils travel).
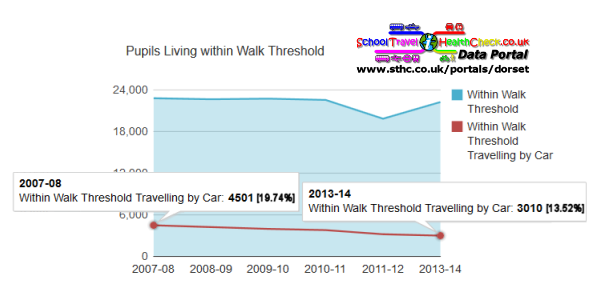
- the number of pupils that live within a realistic walking distance of their school (800m (0.5 miles) for primary, 2km (1.2 miles) for secondary)....
- ....as well as the number of those pupils who nonetheless still travel to school by car rather than walk or cycle.
- the minimum possible total travel distances given the current geographic distribution of the pupil population and the schools that serve them.
- an overall travel carbon footprint for all pupil journeys to school by vehicular modes of travel, and the number of calories burned through walking and cycling journeys.
What's more ...
- if you can calculate these for one school day then you can calculate them for a school week (5 days) and a school year (190 days).
- if you repeat the analysis in exactly the same way for every pupil, in every school in every client authority, then you can directly compare “apples with apples”.
- if you repeat the analysis in exactly the same way every year, then you can see if there is any change over time (as well of course actually visualising and quantifying the change).
The following factors are used in our subsequent calculations to create the STHC analysis output:-
These are based on the official UK government greenhouse gas conversion factors, first calculated by DEFRA (the UK Department for the Environment, Food and Rural Affairs) in 2007 as follows:-
| Mode of Travel | CO2 Emission Factor Per km | Reference |
|---|---|---|
| 0.2042 kg CO2/vehicular km converted to 0.2042 kg CO2/passenger km |
Table 6 – Combined average for petrol & diesel cars | |
| 0.2042 kg CO2/vehicular km converted to 0.1021 kg CO2/passenger km |
Table 6 – Combined average for petrol & diesel cars | |
| 0.0891 kg CO2/passenger km | Table 8 – Bus | |
| 0.0602 kg CO2/passenger km | Table 8 – National rail | |
| 0.0650 kg CO2/passenger km | Table 8 – Light rail & tram | |
| 0.0526 kg CO2/passenger km | Table 8 – London Underground |
Source: “Greenhouse Gas Conversion Factors For Company Reporting”, DEFRA (2007). (URL: www.ukconversionfactorscarbonsmart.co.uk/)
Notes:-
1. Per Vehicular Kiliometre vs per Passenger Kilometre - The 2007 DEFRA figures quote the carbon emmission factor for "Cars / Vans" in terms of kg CO2 per vehicular kilometre, whilst all the others are per passenger kilometres.
2. Evolution Of Calculation Factors Over Time - DEFRA first published an official list of emission factors in 2007, which was the same time as the STHC was being launched as a generally available service to all local authorities. Thus we adopted the DEFRA figures to calculate the school travel carbon footprints for the STHC. Since then however DEFRA have revised the figures just about every year as the science behind determining and measuring all the individual factors involved in greenhouse gas emmissions has improved. With each revision however the calculation of the factors has become more complex, and not every factor is revised each time. To keep things simple therefore, and to enable "like-for-like" comparison between analysis years, we have continued to use the original 2007 figure in our STHC carbon footprint calculations. Rather than just treating this as an exercise in arithmetic, perhaps you would like to delve further into this whole issue and see what difference these revisions make to the calculated carbon footprint figure for your school. Unfortunately pre-2013 carbon conversion factors are no longer available on the DEFRA website and do not appear to have made into the official government web archive. Thus for the sake of continuity you can click on the following links to download each revision of the official figures from our archive instead - 2007, 2008, 2009 , 2010, 2012, 2013, 2014 and 2015.
These are based on the work of Roger Mackett, a professor of Transport Studies at University College London and one of the UKs’ leading researchers into the role of travel as a facilitator for children’s health:-
| Mode of Travel | Average Speed | Calorie Burn Rate | Calories Burned Per Km |
|---|---|---|---|
| 3.2 km/hour | 1.85 cal/min | 34.69 cal/km | |
| 16 km/hour | 1.4 cal/min | 5.25 cal/km |
| Mode of Travel | Average Speed | Calorie Burn Rate | Calories Burned Per Km |
|---|---|---|---|
| 3.2 km/hour | 2.85 cal/min | 53.44 cal/km | |
| 16 km/hour | 2.15 cal/min | 8.06 cal/km |
Source: "The therapeutic value of children’s everyday travel" - Mackett, R.L., Lucas, L, Paskins, J. and Turbin, J. (2004). (URL: http://eprints.ucl.ac.uk/1421/)
To help schools and school travel professionals get an immediate indication of how an individual school compares to the others in the authority in terms of sustainable school travel, as well as giving them a start on setting SMART (Sustainable, Measurable, Attainable, Reasonable & Time-bound) targets to do something about it, we devised a simple traffic light system (ie. results coded as either "Red", "Amber" or "Green") of STHC Sustainable School Travel Indicators:-
- Number Pupils Within a Realistic Walk Threshold Coming by Car" - is the short term indicator in that it is something that can be immediately tackled by the school itself if it put its mind to it with the help of the school travel professionals - awareness raising campaigns like Walk Once a Week (WOW), "Park & Stride" schemes, better cycling / pedestrian infrastructure etc. It is also a concept that everybody can understand ("why are they not walking when it's such a short distance?"), and therefore buy into the idea of tackling. From our point of view it also is something that can be easily and consistently measured, and so it is obvious if progress is being made in tackling the issue or not.
- Amount of CO2 Per Pupil Travel Emissions Compared To The Authority Average - is a longer term indicator because, although the concept is fairly easy to understand - the further you drive the more CO2 is produced - tackling the issue is not so straight forward and there is no single, easily understood target that everybody can immediately work towards. Any progress will require sustained action over a longer period of time. From our point of view it also is something that is more difficult to measure.
These indicators were devised in consultation with client authorities when the School Travel Health Check service first started. We started out with just the CO2 indicator but it soon became clear that there are some contributing factors that are beyond a schools control, and therefore this would undermine any efforts to make any progress on improving sustainable school travel if this was the only measure of progress. For example the geographic fact that a school is rural often dictates that pupils will have to travel a greater distance and from a wider catchment area where a car or school bus are the only available options, which will result in a larger carbon footprint per pupil for the school journey (= Amber or Red Long Term Indicator). There is very little a school can do to change this reality, but this shouldn't stop them from raising awareness on the issue within their school community and working towards goals that are meaningful to them.
However it is also clear that indicators cannot tell the full story in isolation and need to be considered in conjunction with other data. For example for our same rural school it is often the case that there are very few (if any) pupils living within the walk threshold and so it would probably get a Green Short Term Indicator. However we've already seen that pupils will come from further away so the carbon footprint will be higher, but even this is not straightforward. Intuition dictates that it would be better if the pupils were travelling by bus but what if most of them were being bussed in from a considerable distance away, perhaps from the edge of the nearest large settlement, to boost school numbers? Is that better than kids travelling by car on a more individual basis from a much shorter distance?
We are continually consulting with out clients and the wider school travel community on how our indicators could be improved to help schools work towards more sustainable travel.
The STHC analysis results calculated for each individual pupil are aggregated (”sliced and diced”) in different ways for reporting purposes:-
- Individual School - All results for a school are reported in the same place. The school is selected from the drop-down list at the top of the page and the contents - bar charts, line charts, tables & maps - will update accordingly. You can only view one school at a time, but there is nothing to stop users opening up the pages in another browser window so schools could be compared side by side.
- All-Schools - Key results for all individual schools in the authority are reported side-by-side, enabling direct comparison between them. These are presented as interactive tables or a Geostatistical Atlas of maps, charts & tables that can be ranked from highest to lowest for a variety of criteria so you can see how a given school compares to the others.
- Whole Authority (LA) - Results of all individual school are aggregated together to give a "whole authority" figure.
Pages are also organised by the number of years of analysis results they contain:-
- Latest Year -The most recent year of results only.
- All Years - Results for all the years we have undertaken the STHC analysis for the authority. Note the interactive maps pages are only available for the latest year.
These are presented:-
- At a range of geographic levels:-
- Pan-Regional (if appropriate)
- Pan-LEA
- Individual School
- By national curriculum year:-
- aggregated into generic school types (primary, secondary, sixth form)
- by individual year group
- Showing change over time
By adding in the spatial dimension to the mix it means that, in addition to the age range of the pupils (ie. primary, secondary etc.) and their socio-demographics (eg. gender, ethnicity, free school meal entitlement erc.), the results of the STHC analysis can also be reported (ie. "sliced-and-diced") in terms of all sorts of geographies such as:-
- electoral areas such as local authority wards or national parliamentary constituencies
- health board areas
- census output areas (both medium and super output areas)
The STHC Data Portal contains the next generation of School Travel Health Check analysis output. All the STHC data tables, charts and maps previously spread between different file types - Excel spreadsheets, MapInfo GIS, Instant Atlas, Google Earth etc. - are now delivered through this single, interactive web portal, which is viewable in any HTML5 compatible browser (including mobile devices).
Through the portal a client authorities STHC analysis results are made as publicly accessible as possible, but with password protection granting variable levels of viewing rights where it is absolutely required. This is namely any maps showing individual pupils icons, which are otherwise rendered as generalised “hot spot maps” to unregistered users.
The portal is arranged into analysis modules, each of which contains several different pages of interactive maps, tables and charts. This section describes these in further detail:-
Alternatively Go straight to our demonstration STHC Data Portal (opens in a new window)
Note as always we welcome feedback on how our STHC Data Portal can be further improved to enhance joined-up working within local authorities, as well as provide learning & management resources for schools and the communities they serve.
Previous STHC output formats are still available on request, as is our School Pack service.
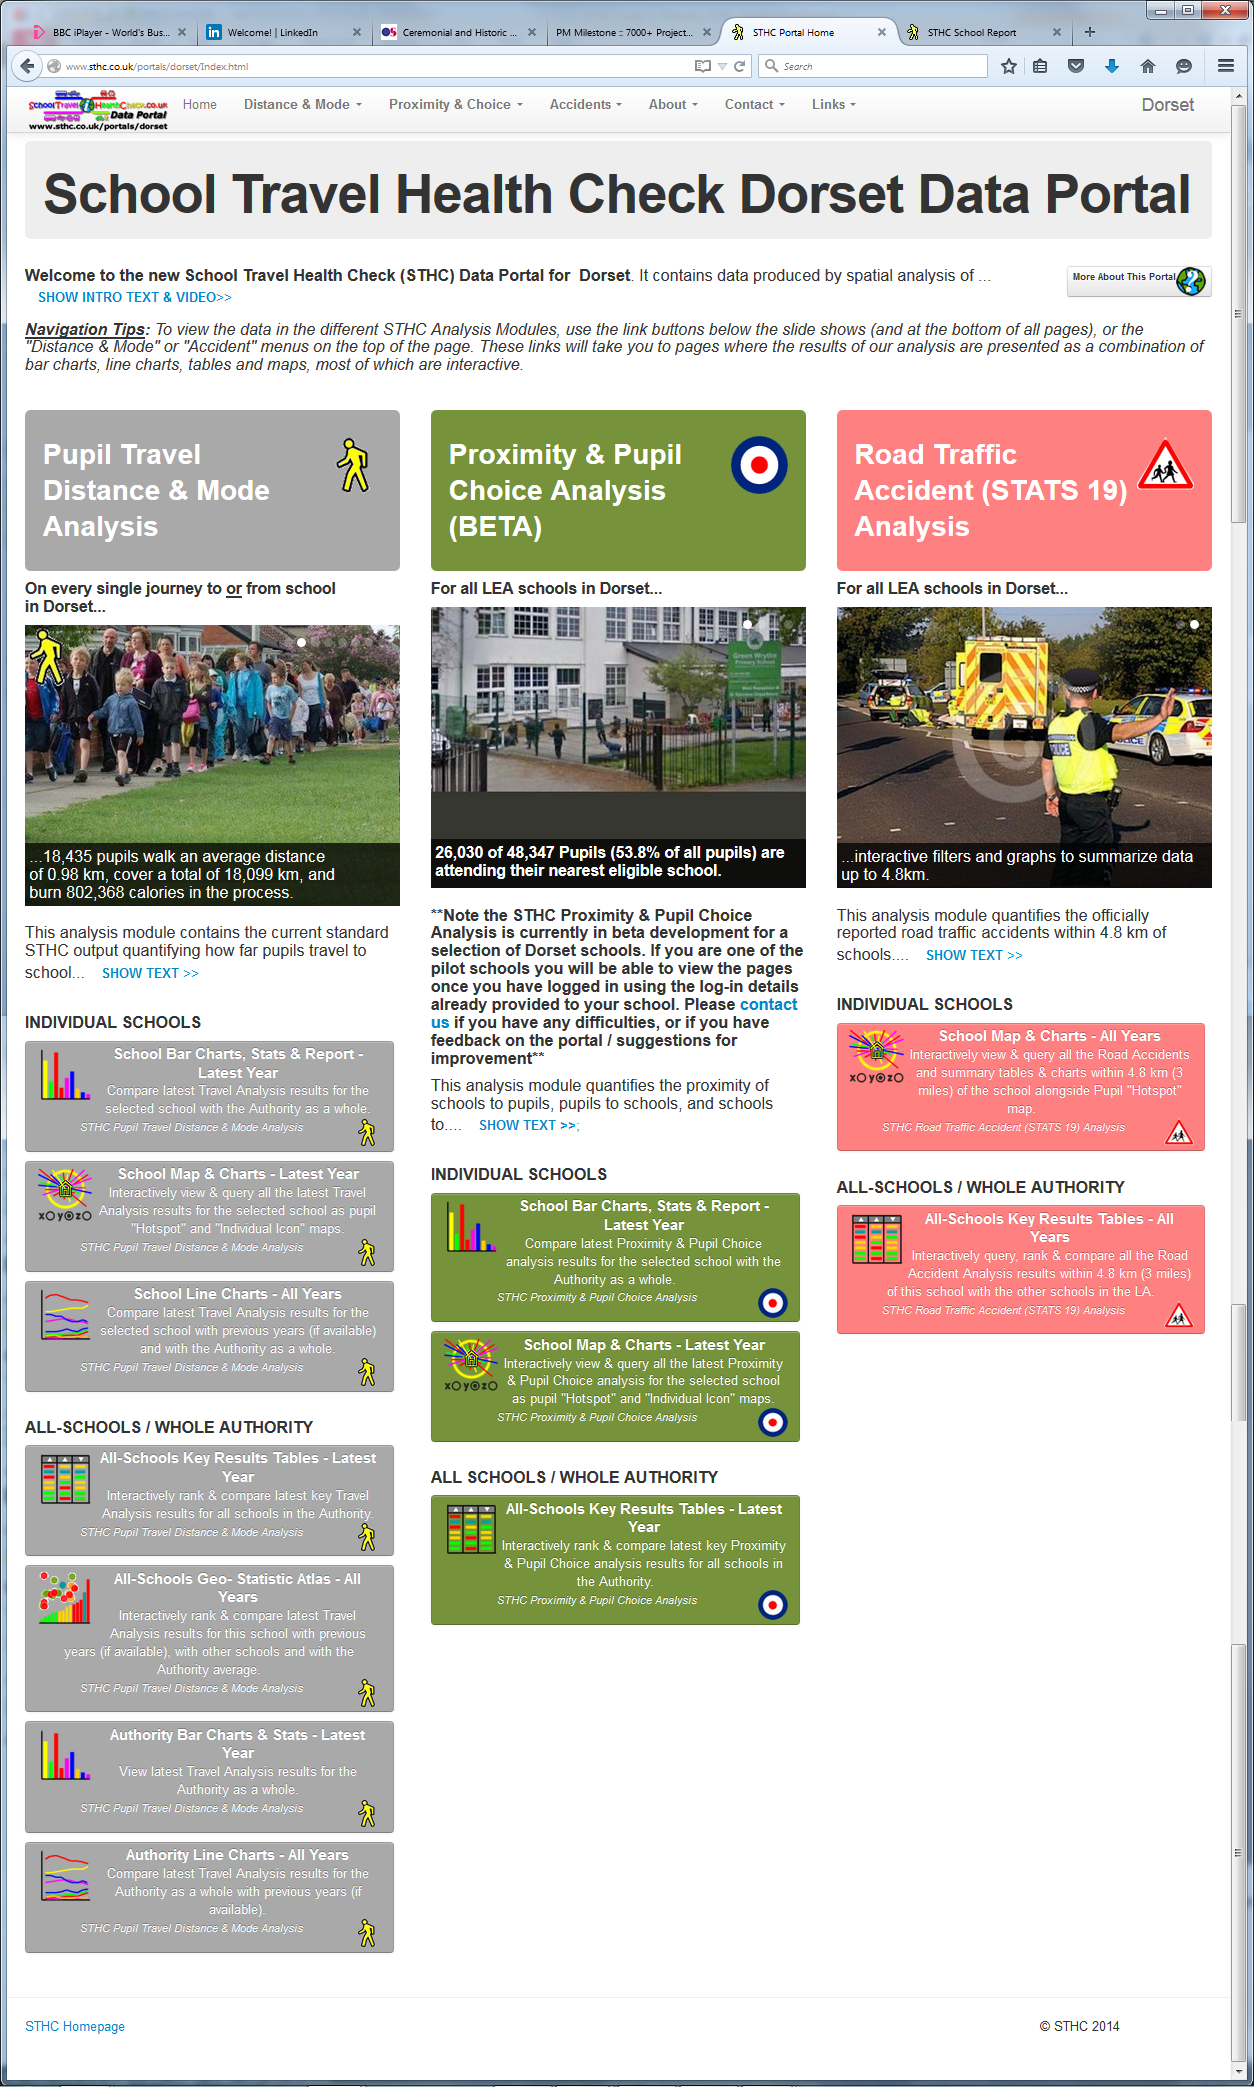
The Pupil Travel Distance & Mode Analysis module contains the current standard STHC output quantifying how far pupils travel to school and the carbon & calorie footprints of the journeys. Results are broken down by Pupil Usual Mode of Travel if this data has been provided to us by the client. If no pupil travel mode data is available then the mode for all pupils is recorded as "Unknown". We can still calculate Travel Distances but obviously it will not be possible to break down results by travel mode, or calculate the carbon & calorie footprints of the journeys.
The following sections are in the Pupil Travel Distance & Mode Analysis module:-
School Bar Charts, Stats & Report - Latest Year
The latest available years STHC Pupil Travel Distance & Mode Analysis results for individual schools are quantified and visualised in this section as static bar charts and headline statistics. The corresponding values for the authority as a whole are also given alongside as a comparison.
The STHC School Report can also be accessed in this section. This summarises the contents of this module for the selected school in a single web page, which has been formatted to be printed out at A4 (currently extends to 10 pages). This report forms part of the STHC School Pack output.
School Map & Charts - Latest Year
The latest available years STHC Pupil Travel Distance & Mode Analysis results for individual schools are quantified and visualised in this section as an interactive webmap with associated bar charts. Use the options panel to filter the data on a combination of Pupil Usual Mode of Travel, National Curriculum Year (NCY) range, and maximum travel distance and the pupil distribution map, summary data tables and bar charts will be automatically updated accordingly.
School Line Charts - All Available Years
All available years STHC Pupil Travel Distance & Mode Analysis results for individual schools are quantified and visualised in this section as static line charts. The corresponding values for the authority as a whole are also given alongside as a comparison.
All-Schools Key Results Tables - Latest Year
The latest available years STHC Pupil Travel Distance & Mode Analysis key results for every individual school are quantified and visualised side by side in this section as a series of interactive tables. Each table shows one key result broken down by mode of travel (if available), which can be re-ordered by clicking on any column heading. Tables can also be filtered generic school type.
All-Schools Geo-Statistical Atlas - All Years
All available years STHC Pupil Travel Distance & Mode Analysis results for every individual school are quantified and visualised in this section as an interactive, geo-statistical atlas. To view a particular data field, click on the "Change Data" button and select the analysis data and the year you wish to look at. The map and surrounding charts will then update automatically.
Authority Bar Charts & Stats - Latest Years
The latest available years STHC Pupil Travel Distance & Mode Analysis results for the authority as a whole are quantified and visualised in this section as static bar charts and headline statistics.
Authority Line Charts - All Years
All available years STHC Pupil Travel Distance & Mode Analysis results for the authority as a whole are quantified and visualised in this section as static bar charts and headline statistics.
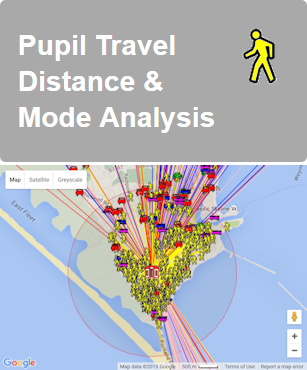
The Road Traffic Accident (STATS 19) Data Analysis module quantifies the officially reported road traffic accidents within 4.8 km of schools. Accidents all involve casualties and have been recorded via the official police STATS19 accident reporting system, with nationally available data going back to 2005. As well as the ability to see all the accidents around a school on a an interactive map, users can also compare accident analysis results between all schools side by side on an interactive table.
Although there is no direct link between an accident and a specific school recorded in the STATS19 dataset, there are some data fields that, taken together, provide evidence that the accident is at least of relevance to school travel:-
- child involvement via the age of a casualty (which may be a driver of a vehicle, a passenger or a pedestrian).
- time of day and day of the week at which the accident occurred (eg. did it occur during usual school travel times?).
- purpose of the vehicles journey (commuting to/from work, for work, taking pupil to/from school or Other/Not known).
- location of accident and therefore its distance from a given school (as measured by our spatial analysis).
The following sections are in the Road Traffic Accident (STATS 19) Data Analysis module:-
School Map & Charts - Latest Year
The interactive map on the School Map & Charts - Latest Year page allows users to see all the accidents from the selected school since 2005. The data can be filtered using a combination of:-
- day of the week
- time of day
- year (since 2005)
- child involvement
- distance from the school - up to 4.8 km (about 3 miles)
The results tables, charts and Google accident map will be automatically updated.
All-Schools Key Results Tables - All Available Years
The latest available years STHC Pupil Travel Distance & Mode Analysis key results for every individual school are quantified and visualised side by side in this section as a series of interactive tables. Each table shows one key result broken down by mode of travel (if available), which can be re-ordered by clicking on any column heading. Tables can also be filtered generic school type.
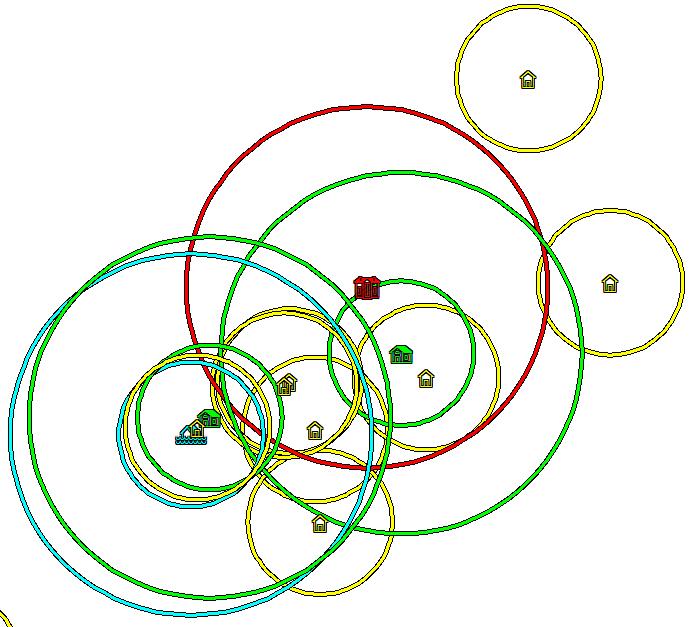
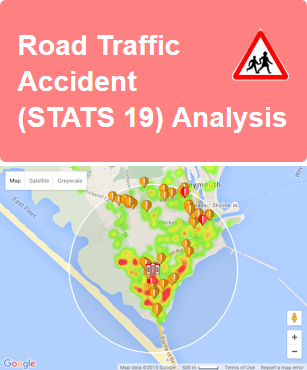
The Proximity & Pupil Choice Analysis module quantifies the proximity of schools to pupils, pupils to schools, and schools to each other. From this are derived pupil choice by distance ranking, "doorstep leakage" of pupils to schools that are not the nearest one (& the extra "child miles" this involves) and the numerical and geodemographic impact on roles if all pupils attended their nearest school.
An immediate applications of this analysis is in quantifying the "leakage" of potential pupils away from a schools own doorstep, which represents a loss of revenue for them. If PUMoT data is available then there is the obvious opportunity of SMART targeting for modeshift ("in this schools walk threshold X number of kids are driving Y number of miles to various other schools, which is Z "child miles" more than if they walked to this school on their own doorstep"). Lack of PUMoT data makes the results less rich, but does not prevent the analysis from being undertaken.
Creation of this Proximity & Pupil Choice Analysis module does not require Pupil Usual Mode of Travel data as the pupil location is part of core National School Census data. However if travel mode data is available for the selected school, there is also the ability to use it to further filter the pupils.
The following sections are currently in the Proximity & Pupil Choice Analysis module:-
Note the STHC Proximity & Pupil Choice Analysis is currently in beta development for a selection of Dorset schools. If you are one of the pilot schools you will be able to view the pages once you have logged in using the log-in details already provided to your school. Please contact us if you have any difficulties, or if you have feedback on the portal / suggestions for improvement.
School Bar Charts, Stats & Report - Latest Year
The latest available years STHC Pupil Travel Distance & Mode Analysis results for individual schools are quantified and visualised in this section as static bar charts and headline statistics. The corresponding values for the authority as a whole are also given alongside as a comparison. The latest available STHC Pupil Pupil Proximity & Choice Analysis results for the school are summarised here as static bar charts and headline statistics. The corresponding average per-school values for the authority as a whole are also given alongside as a comparison.
School Map & Charts - Latest Year
The latest available years STHC Proximity & Pupil Choice Analysis results for individual schools are quantified and visualised in this section as an interactive webmap with associated bar charts. Use the Pupil Selection Filter panel to filter the most recent years results to visualise and quantify how many eligible pupils are "leaking away" from the selected schools' "doorstep". This data is derived by analysing all authority pupils against 5 specific criteria:-
- whether they are eligible to attend the school (based on their national curriculum year)
- whether they are currently on the role of the selected school or not
- whether they live within a reasonable walking distance (the "walk threshold") of the selected school
- whether the selected school is their nearest
- whether they live within a the "walk threshold" of their nearest school
These criteria are used as, though there will probably be some eligible pupils living within the walk threshold of the school but not going there, they may well have other schools to choose from on their doorstep which, from a sustainable travel point of view, are an equally valid choice. By drilling down through the "Quick Select" options below, you will gradually weed out these pupils to leave only eligible pupils for whom the school is their nearest choice, who live within walk threshold but they are going to schools elsewhere. Once you are familiar with the concepts you can manually set each of the data parameters to see how they affect the pupil numbers in the "Manual Select (Advanced)" tab.
All-Schools Key Results Tables - Latest Year
The latest available years STHC Pupil Travel Distance & Mode Analysis key results for every individual school are quantified and visualised side by side in this section as a series of interactive tables. Each table shows one key result broken down by mode of travel (if available), which can be re-ordered by clicking on any column heading. Tables can also be filtered generic school type. The latest (2013-14) key results of the Proximity & Pupil Choice ("Doorstep Leakage") Analysis for the most recent available year (2011-12). This is brand new analysis work that is currently being piloted in Dorset. Filter the tables to show only schools of the same generic type, and re-order the table by different data fields to find schools worthy of further investigation - the "Quick Link" will take you to the Latest Year Summary Dashboard for the school.

Additional analysis modules may be added over time as they occur to us, or customers commission them. However as they stand just now, they show that:-
- even in the absence of Pupil Usual Mode of Travel data, meaningful pupil-level results can still be derived from spatial analysis of the basic pupil location data contained in core National School Census data. (That said, the portal makes the value for collecting PuMOT data self-evident when viewers see how much more useful it makes the analysis results to them).
- publicly available spatial datasets such as the Road Traffic Accident (STATS19) data can easily be incorporated and repurposed for not much extra effort. It can be cross-referenced ("mashed") with existing content, greatly increasing the reach and depth of the portal such that the sum of the whole becomes much greater than the sum of the individual datasets.
Albert Ward
School Travel Plan Team leader, Somerset County Council
 We encourage client authorities to put the STHC analysis results back into all their schools (whether or not they collect pupil usual mode of travel data or have a formal school travel plan). After all, this is where the source data comes from in the first place, and this is where we are trying to effect change on the ground (even if they themselves havene't yet expressed an interest in changing!).
Even in this technological age we have found that this is best done as a mix of paper and digital resources that can be used as both management and teaching tools. At the very least, these resources will enable an informed debate around the issues of sustainable travel within the school community based on quantitative analysis of their own data, rather than speculative presumption.
Assuming they have the necessary technical skills and capacity, client authorities can produce their own, school-specific resources from the standard STHC analysis output suite, however the “in-house” option should not be undertaken lightly. The resource commitment in terms of tying up staff and large format printers for the amount of time required to produce packs for all the authority schools can generate internal conflict! Alternatively clients can let us take care of it for them ….
We print, fold and collate each component into an unsealed envelope for each LEA school. These are then boxed in numerical order by DfE Establishment Number and delivered to clients by overnight courier. Clients can then check the contents, perhaps even augmenting them with their own additional content, before sending out to schools via their own internal postal system. Alternatively we can post the packs direct to schools for an additional charge to cover postage.
Our standard STHC School Packs consist of the following components, which are described in more detail in this section:-
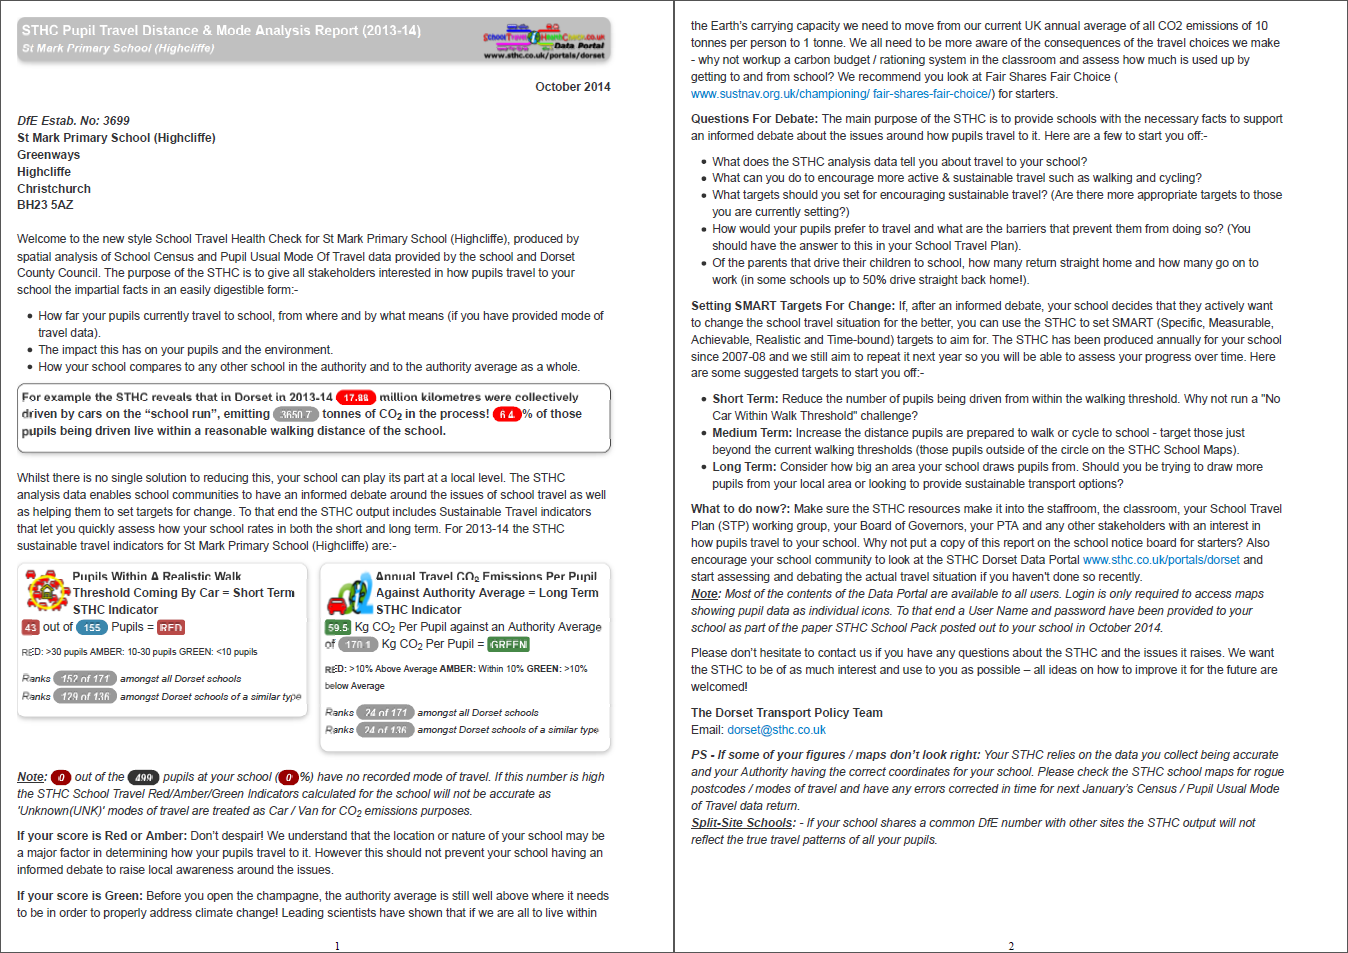
The STHC Standard School Pack Covering Letter serves several purposes:-
- contains the school address so that when printed out with the report, it can be put in an envelope (along with any other relevant content) and posted to the school, either via the authority internal mailing system or by standard post.
- introduces the STHC and puts the accompanying STHC report in context.
- highlights the most significant findings of the STHC analysis that are covered in more detail in the report, such as the overall sustainable travel rating for the school.
- suggests some "Questions For Debate" around the issues to do with travel within the school community.
- advises on setting "SMART Targets For Change" in the short, medium and longer term.
- suggests what the school should do next, keeping the overall tone as positive as possible.
- enables pertinent, authority-specific content to be included like urls of further resources and the names and details of individuals that the school needs to contact for further information about the issues covered.
The standard letter covers 2 sides of A4 when printed. The wording of the letter can be adapted to fit in with client requirements e.g. discussing how the STHC fits in with their own overall service delivery to schools.
Note: The online versiion of the STHC Standard School Pack Covering Letter can be found on the "School Bar Charts, Stats & Report - Latest Year" page of the authorities STHC Data Portal (just click the "View School Report" button in the page header).
 The STHC Standard School Report condenses the most important stats headlines, charts and explanarory text from the Pupil Travel Distance & Mode Analysis module into 8 sides of A4 paper when printed. It consists of the following sections:-
- How Do Your Pupils Travel To School?
- How Far Do Your Pupils Travel To School?
- Total & Average 'Actual' Travel Distances
- Pupils Living Within A Reasonable Walking Distance ("Walk Threshold")
- What Is The Carbon Footprint Of Your Pupils Travel To School?
- Total Pupil Travel CO2 Emissions
- Per Pupil Travel CO2 Emissions
- How Many Calories Are Burned By Your Pupils Travelling To School?
- "Nearest" School & Pupil Travel Distance Analysis
It is always a difficult decision to decide what to include in the report whilst at the same time not overwhelming the recipient with so much information that they just switch off to the message we are trying to get across. As ever, we welcome any feedback about the STHC Standard School Report from schools and client authorities.
Note: The online versiion of the STHC Standard School Report can be found on the "School Bar Charts, Stats & Report - Latest Year" page of the authorities STHC Data Portal (just click the "View School Report" button in the page header).
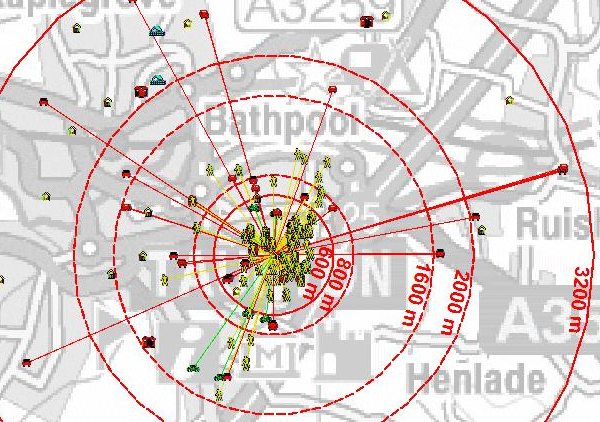
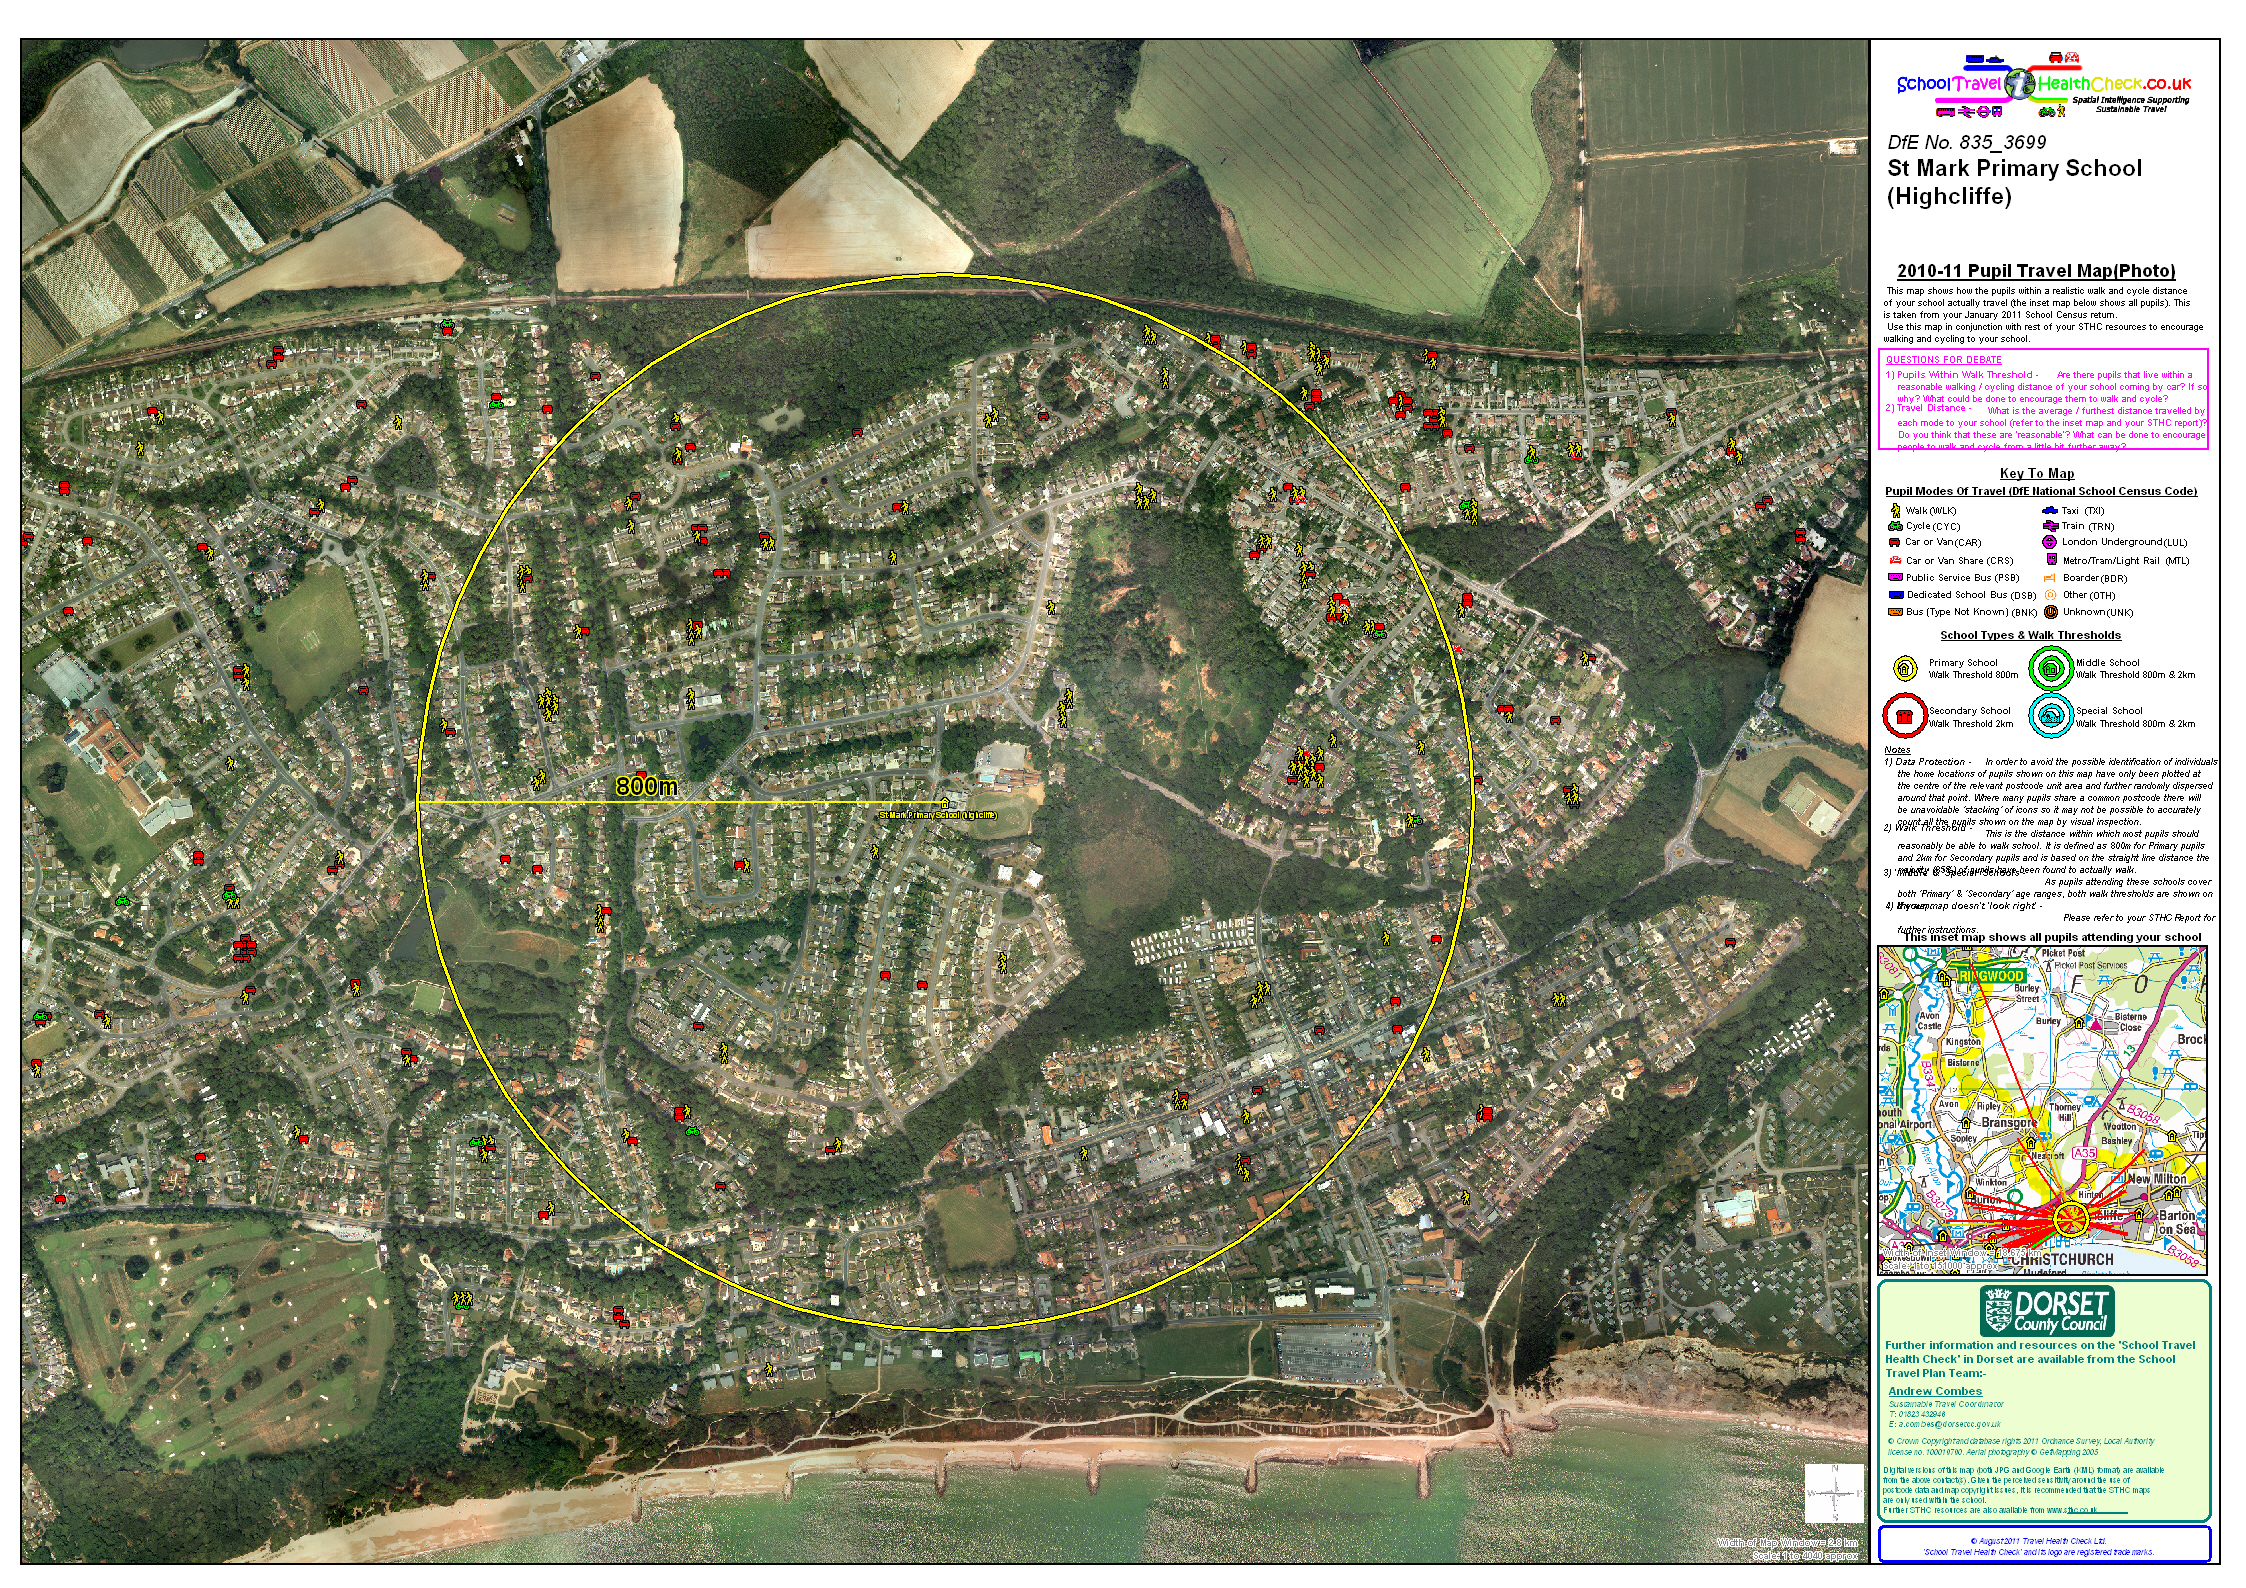
 The Pupil Travel Maps have always been a key component of the STHC output. Their primary purpose is to clearly show where all the pupils that attend the school are travelling from (as well as how they are travelling, if pupil usual mode of travel data has been supplied to us).
In order to fulfil this purpose in the most effective way, we still find there is no substutute for tangible, tactile output - expertly crafted maps on big (A1) bits of paper - delivered back to the school as part of the STHC School Pack.
Yes we have an interactive Pupil Travel Map on the "School Bar Charts, Stats & Report - Latest Year" page of the authorities STHC Data Portal. Yes it allows users to filter the data on a combination of Pupil Usual Mode of Travel, National Curriculum Year (NCY) range, and maximum travel distance. But you can't pin it up in the headteachers office wall as a permanently "on" resource! And let's not forget, it's also a permanently visible "business card" for the local authority sustainable / active travel delivery team!
The key features of the Pupil Travel Maps include:-
- main map window basemap is either high quality aerial imagery (supplied to us by the local authority directly), or the appropriate street-level scale of Ordnance Survey topographic map.
- main map window is centred on the school, which is depicted with the appropriate coloured icon, and the full name.
- the appropriate walk threshold is also shown as an appropriately coloured circle around the school, with the walk threshold distance shown as a labelled radius line (800m for primary schools, 2000m for secondary).
- pupils are depicted by the appropriate coloured, mode-of-travel icon, which are standard throughout the STHC output. (If no pupil usual mode of travel data has been supplied for any pupil, they are depicted by the Unknown (UNK) icon).
- inset map in the legend panel shows the lines of travel for all pupils that attend the school, as well as the other schools and associated walk thresholds they are passing by en-route. Note the inset map window is automatically configured to include all pupils travelling to the school, so the scale is dependant on the length of the longest pupil travel line (ie. it will be school-specific).
- legend panel also contains appropriate user notes on data protection issues etc., some "Questions For Debate" suggested by the map resource, as well as the local contact details for further information on the STHC in the authority.
The paper versions of the Pupil Travel Maps are printed directly from MapInfo, our GIS software, using a bespoke, automated printing routine honed and developed by us since the STHC began. With 2 maps per school and up to 550 schools in an authority (the biggest one we have handled to date), that's a lot of maps to print off and compile into School Packs in a short space of time, so we have had to make the process as automated as possible!
Digital versions (screenshots) of the Pupil Travel Maps are also produced as additional output files (in .jpg format) from our printing routine. These are discussed in the relevant section of the Supporting Digital Files section.
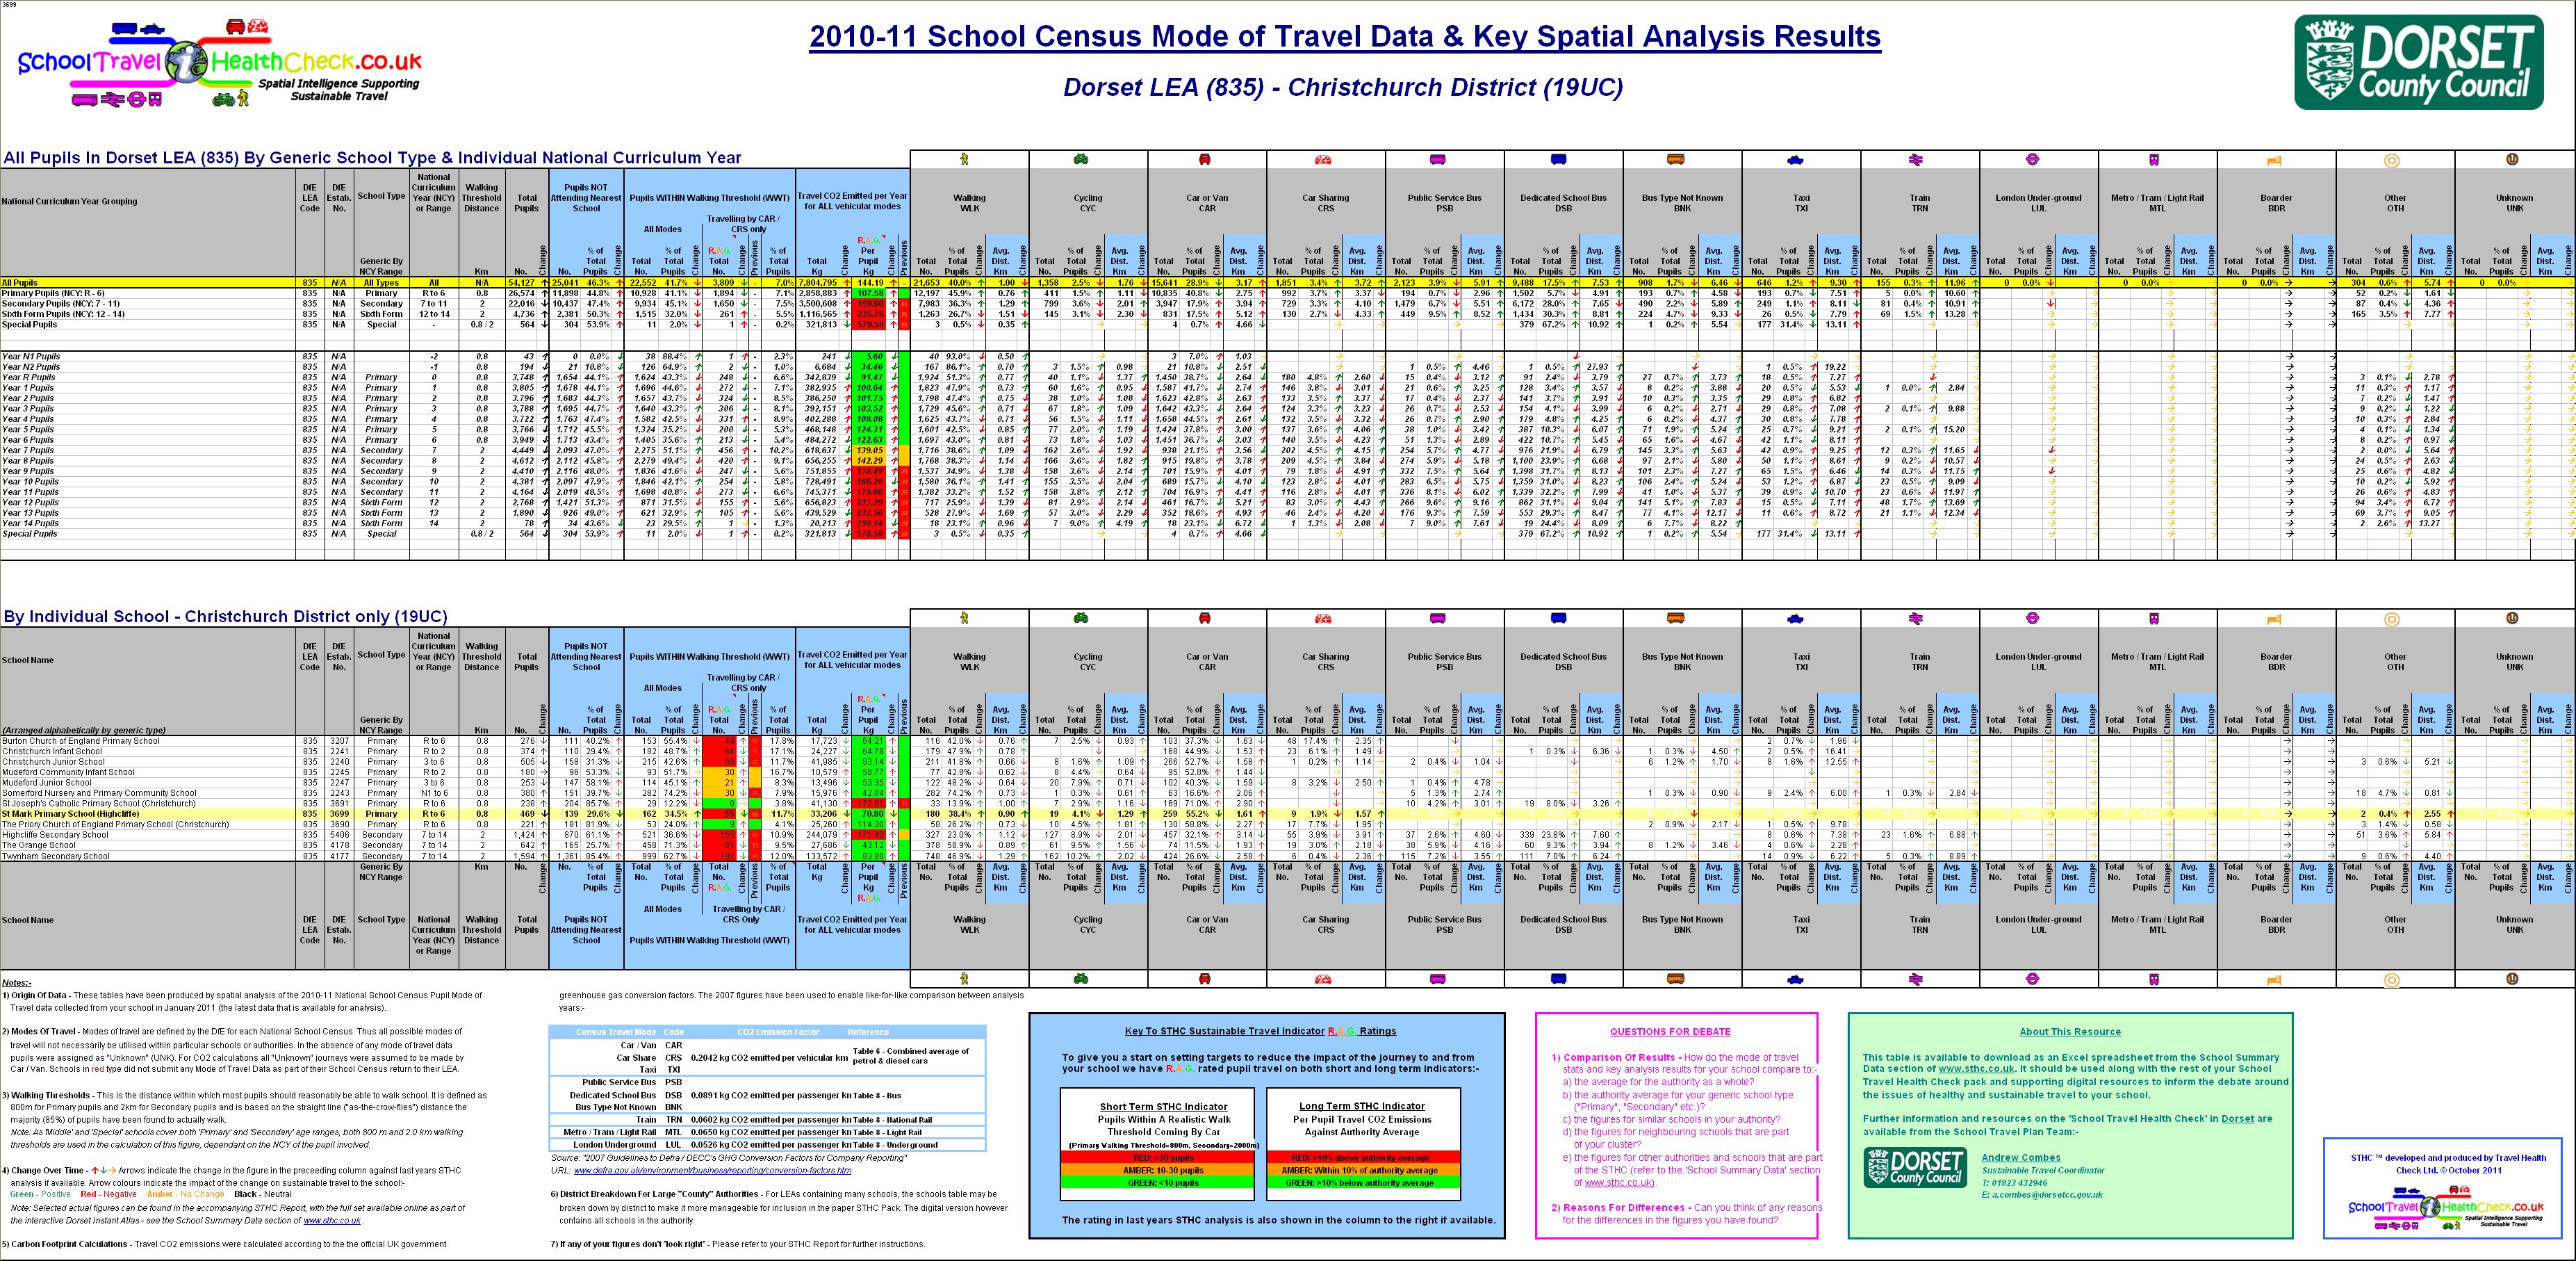 The Key Analaysis Results Table has always been a key component of the STHC output. Its primary purpose is to enable stakeholders to easily compare and contrast the STHC analysis results from all the different standard reporting levels for the authority on a single, printed page (allbeit a large one!).
There are actually 2 tables on the one sheet:-
- Key Results by National Curriculum Year (NCY) Grouping (Top Table):-
- All Pupils (ie. all pupils between Nursery 1 and Year 14)
- Primary Pupils (ie. all pupils between Reception and Year 6)
- Secondary Pupils (ie. all pupils between Year 7 and Year 11)
- Sixth Form Pupils (ie. all pupils between Year 12 and Year 14)
- Special Pupils (ie. all pupils between Reception and Year 6)
- By Individual National Curriculum Year (NCY), with values ranging from N1 - 14
- Key Results by Individual School (Bottom Table) - reports results by Individual School.
In the print version included in the STHC School Pack, the schools are arranged alphabetically within each generic school type, with the data row for the particular school highlighted in yellow with bold text. This enable users in the school to easily see how their results compare with other schools in the authority, the average for their generic school type, or the authority as a whole.
Also on the sheet are appropriate user notes on data protection issues etc., some "Questions For Debate" suggested by the resource, as well as the local contact details for further information on the STHC in the authority.
The paper versions of the Key Analaysis Results Table are printed directly from Microsoft Excel, using a bespoke, automated printing routine honed and developed by us since the STHC began. With up to 550 schools in an authority (the biggest one we have handled to date), that's a lot of tables to print off and compile into School Packs in a short space of time, so we have had to make the process as automated as possible!
Digital versions of the Key Analaysis Results Table are also available. These are discussed in the relevant section of the Supporting Digital Files section.
We also include extra copies of example STHC School Packs as STHC Promotion Packs that can be used to share with colleagues and raise the profile of the work internally within the local authority.
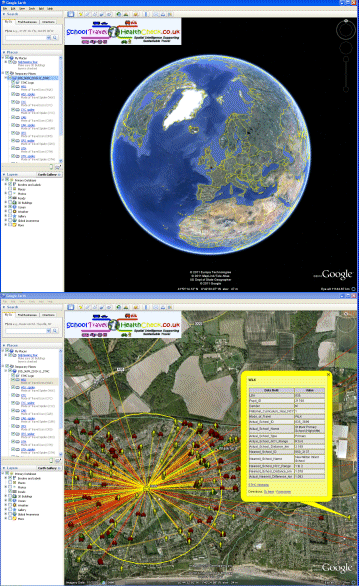
Before we created the STHC Data Portal, all the STHC analaysis output data for a particular authority was delivered as a suite of different files of various types - Excel spreadsheets, MapInfo GIS, Instant Atlas, Google Earth etc. This was the only way of being able to utilise the full range of visualisations for our analysis data ie. tables, charts and maps, and share them with client authorities. However the total size of all the files for a single authority would run into several gigabytes (digital mapping / GIS files can be very large). This had obvious issues when it came to sharing data with schools, which was the main driver for creating the paper STHC School Packs.
The STHC Data Portal has solved the problem of being able to put the full range of data visualisations in one place, which can also easily be accessed by all the stakeholders in an easy to use way. However there is still a requirement for some of the previous stand-alone file output, in particular the GIS files., which must be guided by data protection requirements seeing as how we are still dealing with individual pupil data. Thus we still issue a Final Data Pack (ie. USB stick) containing all the Supporting Digital File Output to our local authority contact. They then share the files with whoever they think should have them. We do not currently distribute any files via the portal, but this is something we are willing to look at in the future if there is a demand from client authorities and schools.
The supporting STHC digital file output consists of the following, which are described in more detail in this section:-:-
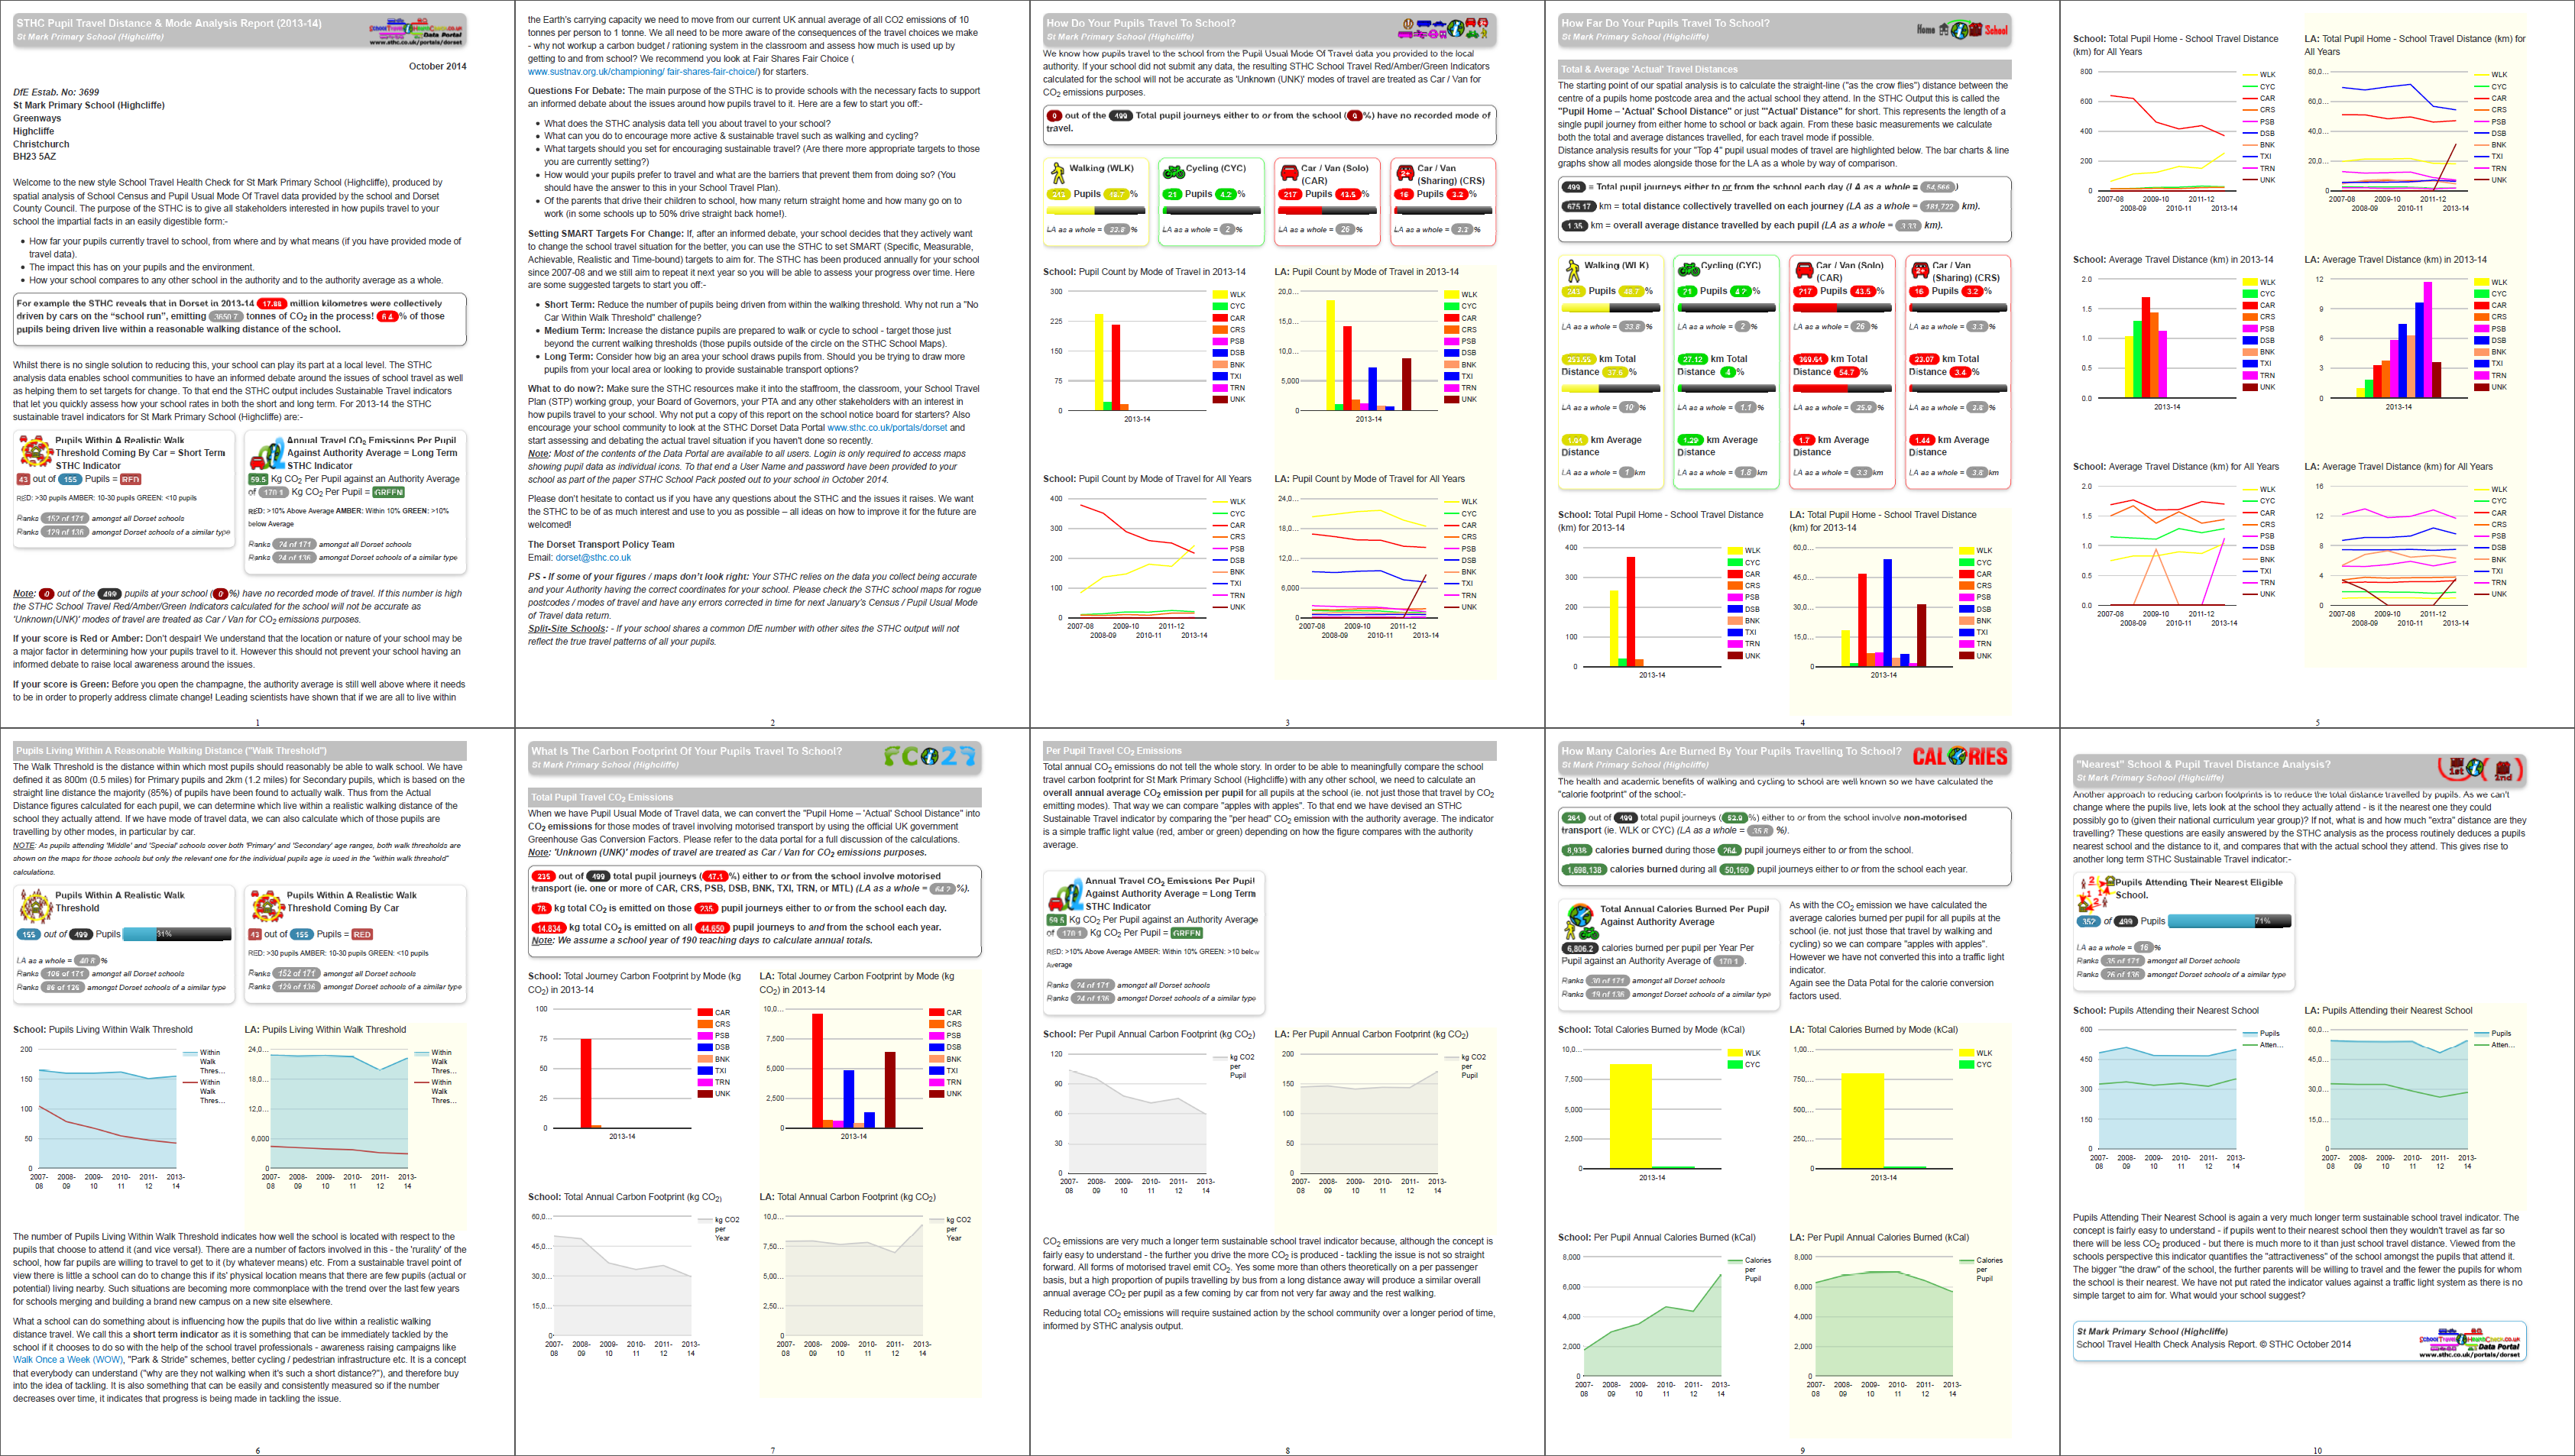 The STHC School Report & Covering Letter is part of the paper STHC School Pack output. However an online version can be viewed on the "School Bar Charts, Stats & Report" page of the authorities STHC Data Portal. Click on the "View School Report Button" on the header and the Report & Covering Letter will open up as a "print friendly" web page in a new browser tab. It can then be either printed out to paper, or as a pdf file using a pdf print driver like do-pdf, which can then be saved to your hard disk.
These are screenshot imges of the Pupil Travel Maps that form part of the paper STHC School Pack. They are produced as additional output files (in .jpg format) from our bespoke, automated MapInfo printing routine. The image files are created at 2 different resolutions:-
- Hi Resolution - 4491 x 3176 pixels - suitable for printing up to A1 size - approx file size ~5 MB (OS map background) and ~11 MB (photo background)
- Medium Resolution - 2246 x 1588 pixels - suitable for printing up to A3 size - approx file size ~4 MB (OS ap background) and ~5 MB (photo background)
The Pupil Travel Map Image files fulfil 3 main purposes:-
- provides client officers with a visual record of the paper maps that have been supplied to their schools.
- can be quickly printed to provide additional paper copies of the maps, as long as there is access to a suitable printer. The high resolution images can be printed up to A1 size, the medium resolution up to A3.
- provides schools with a "proper cartographic" digital map (as opposed to a webmap like those in Google), that can be projected in the classroom as well as pasted in their School Travel Plan document. This has probably been superceded by the interactive Pupil Travel Map on the "School Bar Charts, Stats & Report - Latest Year" page of the authorities STHC Data Portal, but it remains an opotion for schools none the less.
 Having the output analysis data as Geographic Information System (GIS) files will enable clients to:-
- "see" their data plotted on a digital map or aerial photography background within their own authority GIS environment.
- undertake further geospatial analysis as required (it is usual for our data to generate as many more questions as it answers!)
GIS files are supplied in MapInfo format as standard as this is the software we use to undertake our spatial analysis. MapInfo is one of the worlds leading desktop GIS software packages and a well-recognised "industry standard".
Alternative GIS formats (eg. ESRI .shp files) may be accommodated but this will involve an additional charge for data translation. Alternatively it may be possible for data translation to be carried out by your own internal GIS team. We can provide technical liaison, including sample data, to help facilitate the process.
More information on GIS use within you authority will be available internally from your GIS system administrator, or your Authority Liaison Officer (ALO), who is responsible for the distribution of all the digital map data products supplied under the national, local authority Mapping Services Agreement (MSA).
Pupil Travel Map data for each school can also be supplied to clients as a .kml file that can be viewed interactively in the freely available Google Earth application. There is an "All LEA Schools" kml file which shows all the schools in the LEA and their walk thresholds, with the school-level results appearing in the ballon when users click on the icon. As per the MapInfo GIS output there is also a pupil-level file for each school, showing the school and its walk threshold, as well as all the pupils attending the school as coloured mode of travel icons and a line of travel to the school. The pupil-level results appear in the ballon when users click on the icon.
Emma Sheridan
Former London Regional School Travel Adviser for DfE & DfT and School Travel Manager, Transport for London and Modeshift Chair
Even more so when you take into account that exactly the same suite of STHC digital output can be used:-
- by the many different stakeholders with an interest in achieving modeshift to more active and sustainable modes of travel on the "school run" - professionals (local transport planners, school transport managers, sustainable travel coordinators, school estate planners & managers, child health professionals etc.), as well as the individual school communities (management teams, teachers, pupils, parents etc.).
- at a strategic level as an evidence base to inform future planning of services & infrastructure. Also by raising the profile of their work internally and externally with colleagues, managers and other stakeholders, potential joint working and funding opportunities may be identified.
- at an operational level to inform day-to-day targeting, prioritising & scheduling of professional resources, as well as providing those professionals with a tangible means of engaging with all schools in their LEA in a consistent and regular way that is both meaningful and constructive.
- as a starting point for further, more detailed analysis (spatial or otherwise) at the local level using in-house skills & resources.
By carrying out the analysis in exactly the same way for every pupil, in every school, in every client authority and adding in the spatial dimension, the STHC makes it possible for all interested parties to:-
- gain business-critical insight into the actual school travel situation on the ground that can only be derived by spatial analysis at individual pupil level in a way that simple "head counts" of pupils by mode will never be able to do.
- easily visualise and quantify the current school travel situation, for all schools at both a collective and individual level, over a prolonged period of time, in a consistent way, using interactive, online resources to get the perspective on it they need.
- engage simultaneously with all schools in the authority in a consistent, meaningful and constructive way (whether or not they actually collect pupil usual mode of travel or have a travel plan), using their own data.
- always compare "apples with apples" - whether these "apples" be age ranges, socio-demographics attributes, or the geographic location of both the schools and the pupils that may (or may not!) attend them. This is due to the straightforward nature of the spatial analysis - "as-the-crow-flies" - and the fact that we have results at an individual pupil level which can then be aggregated by any criteria required.
The main purpose of all this analysis however is not just to be clever for the sake of it, but to provide local authorities and school communities with quantitative, spatial intelligence data that will allow them to actually do something about making things better (think global, act local). The STHC analysis output gives them the ability to:-
- debate the issues around sustainable travel within the school community in a way informed by quantitative analysis of their own data rather than speculative presumption and tabloid style, “knee-jerk” reactions.
- arrive at their own assessment of the overall scale of the “school run” problem when compared with other LEAs or schools.
- identify where action needs to be taken, and then target resources and initiatives to those schools where they the most likely to achieve the best return for the limited available resource..
- set targets, ideally SMART* oness (*Sustainable, Measurable, Achievable, Realistic and Time-bound), for those initiatives to deliver in the short, medium and longer term:-
- short term quick wins include running awareness campaigns in schools identified as having the most number of pupils coming by car from within the walk threshold, to highlight the merits of walking or cycling.
- medium term outcomes could be identifying where pupils from a further distance could most easily be persuaded to walk or cycle in the future, perhaps once physical infrastructure has been put in place (eg. a footbridge bridge over a railway line or other barrier may suddenly make cycling / walking a viable option for pupils in a particular location that otherwise have to go by car due to the current journey distance / time).
- longer term outcomes could be assessing how well schools are currently situated to serve the current distribution of pupils, and where strategic changes could be made to reduce the overall total “pupil miles” travelled in the LEA.
- Benchmark and monitor how well these targets are being met. This will give an indication of how effectively initiatives are working to change things on the ground and may well unlock further funding to carry on the good work.
- If the analysis of the annual census data is repeated each year, clients will build up a robust evidence base to inform future strategy and funding.
In the remainder of this section we describe the benefits the STHC brings to the:more specific areas of:-
 Making the analysis output easily available to schools, either via the STHC Data Portal or the paper STHC School Pack, has always been a fundamental principal of the School Travel Health Check. It completes the circle and puts the analysis results back into the place where the source data came from in the first place. It also makes logical sense as the school and the wider school community is where we actually want to effect the behaviour change to more active and sustainable modes of travel.
When schools are exposed to the STHC analysis output:-
- they can see there is a point to collecting pupil usual mode of travel data in the first place as it is actually being used for something useful. And not just useful in the grand scheme of things, but actually something that they can use themselves for both teaching and managing.
- any glaring errors in the source data, such as the miscoding of pupils walking 10 miles round trip a day instead of coming by car, have a better chance of being picked up and corrected before the next round of data collection.
- if the school wishes to start engaging with school travel initiatives, the STHC will give them an initial baseline to work from in the first year of analysis.
- if the school is already actively engaged, the STHC will provide some indication as to the effectiveness of ongoing inititiatives since the previous analysis.
- all schools are naturally "spurred on to do better” when they see their results in comparison with the previous year (or their neighbours!).
Perhaps most importantly though the STHC analysis output gives schools the ability to have an informed debate about the issues around active and sustainable travel within the school community based on the quantitative analysis of their own data rather than speculative presumption and tabloid style, “knee-jerk” reactions. They can still do this whether or not they currently have a travel plan or even collect pupil usual mode of travel data, or are in any other way engaged with the sutaianable / active travel agenda. They can then arrive at their own assessment of the overall scale of the “school run” problem at their school, especially when they can compare themselves with other schools in their authority.
This means that local authority sustainable / active travel teams can engage simultaneously with all schools in the authority in a consistent, meaningful and constructive way. And likewise any schools can inititate engagement with the them, prompted and guided by the STHC output that they have been exposed to. Both will then have something definite and tangible to talk about.
Sharon Payne
East of England Regional School Travel Adviser, DfE & DfT and Sustainable School Travel Strategy Officer, Suffolk County Council
Suffolk County Council first commissioned the STHC analysis data for their 2008-09 school census data. They also commissioned us to produce our STHC Paper Packs on a pilot basis for a selected number of schools. As these were successfully received the plan is to roll them out to all (344) Suffolk LEA-controlled schools next year, as well use them as the foundation for formal lessons plans being drawn up for various Key Stages in different areas of the curriculum.
Trevor Jameson
Headteacher, St. George's Primary School, Portland
“Great to have some measurable targets / data to use to set future targets and develop the travel plan. Fantastic maps.”
Headteacher
Heyeswood First School, Dorset
“Fascinating detailed information, well displayed, very visual. Will use alongside STP at next review.”
Headteacher
St Josephs School, Christchurch
In October 2009 eleven LEA run schools in Dorset received our STHC School Packs for the very first time. Above is some of the feedback received by the Dorset County Council Sustainable Travel Coordinator.
Sustainable Travel has always been at the heart of the STHC, which is the very embodiement of the "Think global, Act local!" philosophy. It chunks down the whole global warming / climate change debate so that it becomes a local issue that individuals and school communities can get a handle on and "do something about". Or, at the very least, it enables them to have an informed debate about whether or not they should be doing something about it.
However there are those that are still of the opinion that global warming isn't an issue, and therefore the environemntal sustainability of personal travel choices isn't important, certainly not important enough to spend tax payers money on anyway..... Well everybody is entitled to their own opinion, but no matter what the prevailing thought is, the beauty of the STHC is that the same spatial analysis results can be used to inform both strategy and operations in so many areas of public policy and service delivery, irespective of why it was originally collected. Public health, local transport planning, road safety, schools estate planning as well as sustainable travel, all benefit from spatial analysis of how far and by what means pupils travel to school.
Phil Cornsih
School Travel Awareness Officer, Torbay Council
Torbay have commissioned the STHC since 2007-08, and have been distributing our STHC Packs to schools since 2008-09.
Emma Sheridan
Former London Regional School Travel Adviser for DfE & DfT and School Travel Manager, Transport for London and Modeshift Chair
Transport for London commissioned the STHC on behalf of 8 London Borough Councils on a pilot basis. Modeshift is the central forum supporting those who are working to achieve shift towards more sustainable and active travel for young people and school communities in the UK.
Ian Selby
School Travel Plans and SMOTS, Bournemouth Borough Council
Bournemouth first commissioned the STHC analysis for their 2007-08 school census data and so are part of the core of SW authorities that has contributed to its rapid development over the last year. They also commissioned STHC Paper Packs for the first time for 2008-09.
Kevin Speakman
School Travel Plans and SMOTS, North Somersetl
North Somerset also first commissioned the STHC analysis for their 2007-08 school census data but have also taken the STHC Paper Packs for all their schools from the start.
 Towards A School Carbon Management Plan
Sustainable Development Commission (SDC) and the Department For Children, Schools & Families (DCSF) (June 2009)
In June 2009 the SDC and the DCSF jointly published this consultation document. In Section D covering Reducing emissions from school travel and transport, Dorset County Councils use of the STHC is the only example cited of the best use of existing data to inform individual schools of their performance and to identify actions.
“School Travel Plans are only as good as the data on which they are developed. Establishing better quality data sources to underpin School Travel Plans could help schools and School Travel Advisors to target their activities more effectively.
It could also provide a basis for more consistent monitoring (for example, establishing a consistent method of measuring the impact of schemes, benchmarking of activities and comparison of schools and local authorities).
Improved school travel data can also link into local authority work on National Indicator 186 (Per Capita Carbon Emissions in the local authority area). In particular, it can help local authorities to better understand the impact of school travel and the opportunities for interventions.
Existing data sources can be better used (as evidenced by the Dorset County Council [STHC] case study). It is important that Regional and Local School Travel Advisers understand the data that is available to them and how it can be used and interpreted. Existing data can also be used to inform individual schools of their performance and to identify actions.”
Download the full document from our website here (.pdf, 0.4 MB).
According to the UK Government Chief Medical Officer, active travel to school:-
- improves levels of physical activity.
- reduces carbon emissions.
- can help set good exercise habits in early years.
- can help combat the epidemic of childhood and adult obesity.
So how can better value from investment in promoting active travel to school be achieved? Well according to Promoting Active Travel to School: Progress and Potential, it can be achieved by:-
- Using smarter information about travel patterns to and from schools, such as provided by the School Travel Health Check.
- Identifying and supporting schools with the most potential for change (i.e. where there are relatively large numbers of young people not walking or cycling within the walking threshold).
- Recognising and highlighting the economic value associated with the shift from car to walk and cycle. Current estimates place an annual £600 return (much of this made up by short and long term health gains) for each pupil making the shift from car to walk or cycle.* *Value for Money: An Economic Assessment of Investment in Walking and Cycling. Dr A Davis, Department of Health-South West, 2010
- Providing information for prospective parents about the benefits and potential of active travel before decisions on selecting schools are made to encourage a reduction in the number of “child miles” travelled for the school journey.
- Ensuring schools continue to feel supported to change the travel behaviour of their young people.
- Working jointly to promote active travel to school enables a more efficient approach to tackling transport and health issues.
If we want to get rates of cycling and walking up to the levels of the best European communities we need to use this data to make sure our transport plans will make that happen. If we fail to take maximum advantage of this opportunity, we may fail our children.”
Dr Gabriel Scally Regional Director of Public Health for the South West
 Soft Measures – Hard Facts: The Value For Money Of Transport Measures Which Change Travel Behaviour. A Review Of The Evidence
Department of Health / Highways Agency / NHS South West / Travelwise / South West Regional Development Agency (January 2011)
The STHC is cited throughout this review document as the essential evidence base to guide and support intervention on active travel to school.
“This innovative sustainable development initiative aims to provide robust data that will allow schools, planners and individuals to develop more sustainable school travel options.”
“Active travel to school is an important source of physical activity for young people. It could be increased further. These statistics provide a useful baseline against which to measure progress, and should be used in conjunction with a qualitative assessment of local authority and school travel policies.
"The value of each additional young person walking to school has been estimated as £768 from health, less congestion and carbon savings." (p33)
Download the full document from our website here (.pdf, 2.6 MB).
 Promoting Active Travel to School: Progress and Potential
Modeshift / Department of Health / NHS South West (November 2010)
The STHC is cited throughout this briefing paper produced to answer the main questions health professionals often ask about promoting active travel to school:-
- How far can young people reasonably be expected to walk or cycle to school?
- Is any progress being made to get more young people active by promoting walking or cycling to school?
- What is the potential for encouraging more young people to walk or cycle to school?
- What can be done to get better value for money?
Download the full document from our website here (.pdf, 0.5 MB).
 2009 Annual Report
UK Government Chief Medical Officer
The STHC is cited as the example of best practice for public health in the South West Region in the 2009 Annual Report of the UK Government Chief Medical Officer (see "Increasing active travel by schoolchildren" - p73). "The synergies between improving health and slowing climate change should be championed by the Government and health leaders to drive bold lifestyle changes." [Recommended Action]
“This innovative sustainable development initiative aims to provide robust data that will allow schools, planners and individuals to develop more sustainable school travel options.”
“Active travel to school is an important source of physical activity for young people. It could be increased further. These statistics provide a useful baseline against which to measure progress, and should be used in conjunction with a qualitative assessment of local authority and school travel policies.”
Download the full document from our website here (.pdf, 3.6 MB).
There’s no point in setting targets for change if they aren't:-
- Sustainable
- Measurable
- Achievable
- Realistic
- Time-bound
The sections below show how the STHC can be used to set SMART targets for the Short, Medium and Longer term.:-
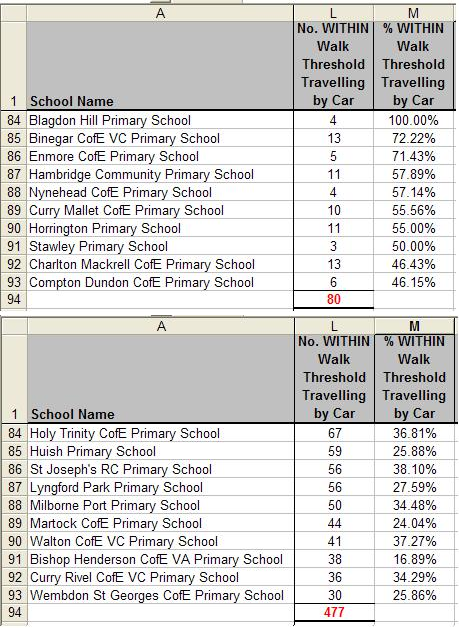
In the short term, a classic "quick win" for clients upon first receiving the STHC analysis data is to re-order the individual school results by "the number of pupils within walk threshold travelling by car". This will give them a target list in descending order of the schools with the biggest potential for modeshift, which can then form the basis of their day-to-day activities for the next few weeks.
Care must be taken here however. Although it is somehow intuitive to look at the percentages to rank potential targets, the measure of success for modal shift is the actual number of journeys where the mode of travel can be changed.
As you can see from the example screenshots opposite from an actual STHC client authority, if we only went by percentages there are only 80 potential modal shift targets spread over the top 10 "offending" schools, compared to 477 if we play the numbers game. A 10% modal shift in these schools would actually result in a lot more CO2 saved!
This is why we report both the absolute numbers as well as percentages throughout the STHC output.
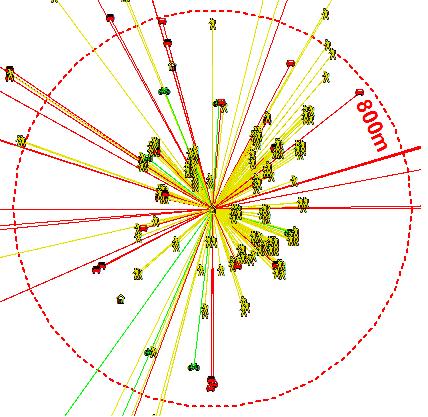
In the medium term the STA Team can look at ways to increase those 85th percentile (threshold) distances by encouraging people to walk and cycle just that little bit further before resorting to their cars. This is where partnership working with local Walking & Cycling initiatives will pay off
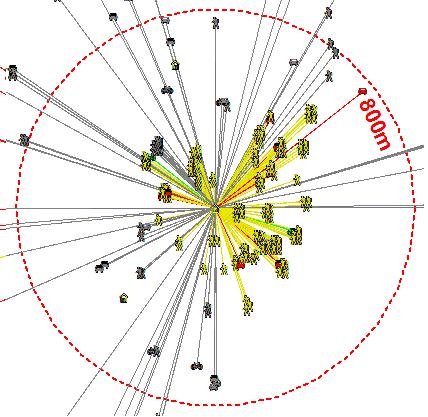
In the longer term it is worth looking closer at all those "greyed" pupils who are passing their local (and often several other) schools on their way to their educational establishment of choice. What can be done to encourage them to walk or cycle to their nearest school rather than be driven to a school much further away because there are no other viable ways of getting there? Ideally authorities want to be making parents realise the travel implications as part of the process of choosing their children’s school rather than having to deal with the consequences of their choice later with long school-runs across town at the busiest times of day.
At an operational level the "nearest distance" figures represent the shortest possible journey for that given set of pupils, which obviously is important when it comes to realistic target setting for authorities, either by themselves or central government (our figures show that the total "child miles" covered by cars in the school run would be reduced by at least 60% if all pupils went to their nearest eligible school (and that’s not taking into account any modeshift!).
The STHC provides a wealth of detailed travel pattern data at a local level that will greatly inform the creation for local transport plans (LPTs).
“We have had to prepare the transport model from scratch and have therefore been involved in an extensive and expensive data collection programme in order to assemble a comprehensive picture of travel patterns and behaviour across South East Dorset. We were therefore delighted to learn about the journey to school data which provided a fully observed picture of travel to school by the variety of modes. The journey to school data was particularly useful in filling in gaps in the travel demand matrices for journeys by private car and public transport. The level of detail and the comprehensive nature of the data meant that it was an ideal basis to supplement the other sources of data.”
“The Journey to school data was vital for us to be able to fill in the gaps between the different roadside interview sites. In other studies we have had to make simplifying assumptions about travel between the interview sites; to be able to use the Journey to School database was a real bonus for us.”
Robert Thompson
Business Manager Policy and Plans, Atkins Transport Planning
STHC data was supplied to Atkins, who were commissioned by Dorset County Council to undertake the South East Dorset Multi Modal Study (underpins LTP3 and MAA).
Soft Measures – Hard Facts: The Value For Money Of Transport Measures Which Change Travel Behaviour. A Review Of The EvidenceDepartment of Health / Highways Agency / NHS South West / Travelwise / South West Regional Development Agency (January 2011)
The STHC is cited throughout this review document as the essential evidence base to guide and support intervention on active travel to school.
“This innovative sustainable development initiative aims to provide robust data that will allow schools, planners and individuals to develop more sustainable school travel options.”
“Active travel to school is an important source of physical activity for young people. It could be increased further. These statistics provide a useful baseline against which to measure progress, and should be used in conjunction with a qualitative assessment of local authority and school travel policies.
"The value of each additional young person walking to school has been estimated as £768 from health, less congestion and carbon savings." (p33)
Download the full document from our website here (.pdf, 2.6 MB).
The STHC has always been useful for road safety in schools because it:-
- informs school travel plans, which in turn inform traffic management strategies outside the school gates, which in turn hopefully reduces the number of accidents.
- initiates and informs discussion in the school community around travelling to school, which can't help but include issues around ensuring personal safety, especially when walking or cycling.
However Our Road Traffic Accident (STATS 19) Data Analysis module, with its ability to visualise and quantify all the officially reported road traffic accidents within 4.8 km of any school going back to 2005, is a complete "game changer" for road safety in schools.
It can be produced for any / all school(s) in any authority in the country, whether or not they are already involved in the Pupil Travel Distance & Mode Analysis aspect of the STHC. This is because it uses free and publicly available national data (the official police STATS19 accident data).
However the power of the portal approach is that once data is incorporated into it, no matter in what initial context, it can be re-purposed for use elsewhere, in conjunction with other data it may not have been "mashed up" with before. For example in the screenshot map opposite you can see the individual STATS19 accident points within the defined distance from the school displayed alongside a "heat map" of the pupils attending the school.
The aim is always to make the sum of the whole information resource very much greater than the sum of the individual datasets from which it is made.
“We've been really impressed with the STHC here in Sandwell. We have most of our schools with travel plans already, so this information will be invaluable for us to take the Travelling to School Initiative to the next level by actually achieving mode shift! Hopefully being able to easily target schools with the biggest potential for mode shift we should be able to get some real results.”
Fleur Tooby
School Travel Adviser, Sandwell Metropolitan Borough Council
Sandwell were the first authority in the West Midlands region to commission the STHC in 2008-09, where it is being used very effectively at a day-to-day operational level.
Our approach to commissioning and pricing is one of "pragmatic flexibility":-
- Transparent pricing policy
- Flexible invoicing
- As short a turn-around as possible once we receive all the client input data specified and it passes all our pre-processing quality control checks.
- We encourage, and will go out of our way to accomodate, joint commissioning and joint working with the subsequent analysis output across local authorities, and between local authorities and other agencies.
GET JOINED UP, AND GET COLLABORATING PEOPLE!!!
In the remainder of this section we describe in more detail:-
In this section we discuss the School Travel Health Check commissioning process:-
Comissioning of the STHC is usually done by a local authority rather than by individual schools. If you are an individual school that is keen on getting the STHC but you are not in an LEA that has commissioned it, then your first port of call should be whoever is responsible for sustainable / active travel issues in your local authority. Point them in the direction of this website and see if you can't persuade them to take things further. They would probably tell you that it would make things easier for them if there were several schools interested so why not try to russle up interest from the other schools in your cluster at the same time? If you are having difficulty with any of these then by all means contact us and we'll see if we can help.
Authorities may commission the STHC service in isolation or in conjunction with their neighbours (each authority is still invoiced on an individual basis). In the latter case additional benefit is achieved for authorities as they can “see” the cross-border movement of pupils between all the authorities that are part of the analysis dataset.
Commissioning the STHC Service is via a simple authority purchase order. We are happy to provide written quotations in advance if clients provide us with the necessary information on the number of schools and pupils in their census data. We are also able to offer flexible, advance invoicing for one or more years worth of output to fit in with clients’ budgetary availability.
We are also happy to liaise directly with the input data providers if there are any concerns of a technical or data protection nature.
If budgets are tight (as if ;-), we would encourage clients to seek out potential funding partners from other groups with similar or complementary objectives. These could from other service areas within the local authority or from other local agencies. For example many authorities are writing the STHC process and packs in to their Local Transport Plan (LTP3) funding cycle to secure it going forward. There may also be opportunities within projects that have managed to obtain Local Sustainable Transport Fund (LSTF) funding.
Albert Ward
School Travel Plan Team leader, Somerset County Council
In this section we discuss the cost of the School Travel Health Check service to client authorities:-
- Overall Average Cost
- Standard Service
- School Packs
- Subsequent Orders
- Examples
- Savings For Joint Commissioning
At an average cost of just £0.15 - £0.22 per pupil per year for standard output and school packs (depending on school set up), the STHC Service represents outstanding value for money on a very modest investment for client authorities in their efforts to achieve travel modeshift on the school run.
The price of the STHC Standard Service for a single census years data processing is set by our transparent pricing formula, so client authorities will always know in advance how much our service is going to cost:-
- £1,500 per Local Authority
- £12 per school
- £0.01 per pupil
All prices quoted exclude VAT.
This will get you:-
- a bespoke STHC Data Portal for your authority, hosted for a year by us, with the following analysis modules:-
- Distance & Mode Analysis Module (includes "Print Friendly" STHC School Report & Covering Letter webpage).
- Accident (STATS 19) Analysis Module (currently comes Free with the Distance & Mode Analysis Module).
- Supporting STHC digital file output:-
- Google Earth map files (.kml).
- Geographic Information System (GIS) files (MapInfo format by default, ESRI format available on request.)
Membership of the "STHC Club" - our aim is continual improvevement of our service by encouraging feedback from client authorities and incorporating their suggestions into subsequent output wherever possible, either by upgrading the standard service or creating new analysis modules. Thus whilst they remain part of the "STHC Club", all authorities will be assured of automatically benefiting from any future improvements to the standard service at no additional cost. They will also receive a discount on any new analysis modules.
As previously stated, client authorities can produce their own, school-specific resources from the standard STHC analysis output suite if they have the necessary technical skills and capacity to do so. The “in-house” option however should not be undertaken lightly. The resource commitment in terms of tying up staff and large format printers for the amount of time required to produce packs for all the authority schools, can generate internal conflict! Alternatively clients can let us take care of it for them.
The price of our School Pack Service is determined by the prefered delivery option:-
- £26 per STHC School - We print, fold and collate each pack component into an unsealed envelope for each LEA school. These are then boxed in numerical order by DfE Establishment Number and delivered to clients by overnight courier. Clients can then check the contents, perhaps even augmenting them with their own additional content, before sealing the envelopes and sending them out to schools via their own internal postal system.
- £28 per STHC School - We print, fold and collate each pack component into an envelope, seal it and post packs directly to schools by Royal Mail.
All prices quoted exclude VAT.
In addition to the physical packs sent to schools, there will also be supporting STHC digital file output of:-
- Pupil Travel Map Image Files (.jpg).
- STHC School Report & Covering Letter as individual Adobe Acrobat filesfor each school.
We absolutely encourage client authorities to repeat the STHC analysis in subsequent years. Alas it will still basically take us a similar amount of time to run the analysis process to generate the STHC output as:-
- its census data, so by definition it changes each year. We hope due to successful travel modeshift measures paying dividends but there are always new children coming into the education system each year and pupils moving up to new school phases.
- there will likely be changes to the school estate - closures, mergers, new schools, existing schools becoming academies, schools changing the range of NCYs they accomodate etc. - so we need to start with a fresh, current school gazetteer file each year.
- we run rigoourous technical quality checks on the input data before processing it and any issues that arise will need to be sorted out with the client authority. This takes time to do!
Thus the cost of subsequent years processing is calculated by the same pricing formula as before. However as mentioned already clients will benefit from continued membership of the "STHC Club", ie. automatic upgrades due to future improvements to the standard output at no additional cost. They will also receive a discount on any new analysis modules.
Thus the available choices for clients in subsequent years are as follows:-
- Repeat processing - cost of susequent years processing is calculated by the same pricing formula as before. Client authorities bespoke STHC Data Portal is updated with the new data.
- Not to repeat processing:-
- they can pay a 10% annual charge based on the Standard STHC Output Charge as calculated by our pricing formula for continued hosting of their portal and to remain part of the "STHC Club" (ie. to receive automatic upgrades of the portal).
- if they choose not to pay the annual hosting charge they will no longer part of the STHC club and the portal files as is will be removed from our server. They will be given all the files necessary for them to host their portal as it stands on another server of their choosing, but they will not receive any further upgrades to their portal.
If authorities re-order full analysis at any point in the future, their portal will of course be updated and restored to our server.
| Cost Element | Calculation | SubTotal |
|---|---|---|
| LEA Standard charge | 1 x £1,500 | £1,500.00 | Schools Component | 270 x £12 | £3,240.00 | Pupil Component | 68,272 x £0.01 | £ 682.72 | Total Standard STHC Output | £5,422.72 | STHC School Packs | 270 x £28 | £7,560.00 | TOTAL STHC COST (exc. VAT) | £12,982.72 | Total Cost Per Pupil | £0.19 |
| Cost Element | Calculation | SubTotal |
|---|---|---|
| LEA Standard charge | 1 x £1,500 | £1,500.00 | Schools Component | 38 x £12 | £456.00 | Pupil Component | 20,304 x £0.01 | £203.04 | Total Standard STHC Output | £2,159.04 | STHC School Packs | 38 x £26 | 988.00 | TOTAL STHC COST (exc. VAT) | £3,147.04 | Total Cost Per Pupil | £0.15 |
If a group of authorities wishes to collectively commission the STHC then there may be room for negotiation on the total price, however this will depend on there being tangible saving in time on our part due to the economies of scale. For example we would need all the client input data before we could begin processing and analysis, but we would rather not have to spend out time having to chase up the data from each authority in order for us to progress as quickly as we would like to :-(
We are happy to explore all options to make the STHC process as timely and efficient as possible for all concerned. This could for example include supply of School Census Data from a single, national source, or incorporating Pupil Usual Mode of Travel data from alternative sources (eg. class "hands up surveys").
In this section we discuss how the School Travel Health Check service is delivered to client authorities:-
The STHC Output is initially supplied to client officers as a beta release Data Portal as soon as is practicably possible, but certainly within 2-3 working weeks after we begin processing the Clinet Input Data (subject to the caveats below).
However before this can be "rolled out" to schools and colleagues, it needs to be checked by the client authority using their local knowledge. This is just to make sure there aren't any glaring errors or ommissions that are not obvious to us. As already stated we do have a rigourous series of quality control checks that we run on both the client input data and the subsequent analysis output. However these cannot pick up the fact that we have been supplied with incorrect grid reference information for the school and it is in the "wrong place". We do not have time to manually check the location of each school and quite frankly if you guys don't know where your schools are, how the heck are we? ;-)
Once it has been agreed that the data portal is as accurate as can be determined at this stage, it can be put on general release. It is normally the responsibility of the client to promote the STHC Data Portal to their schools through their usual channels of communication.
Supporting Digital Files will normally be supplied to the client as part of the Final Data Pack on a USB stick after the beta data portal has been approved for general release. However some / all of the Supporting Digital Files can be supplied to clients before this if there is an urgent need. The 2 methods of interim supply are:-
- email attachment if the files aren't too large (the limitation will be depend on the clients email system but is liable to be of the order of 5 - 10 MB).
- or via our secure, online file transfer service provided by www.hightail.com. (the biggest single file we can transfer is 2 GB, however it is more about the bandwidth and the time it takes to download the files at the clients end).
Of course if the required files are too large to be supplied remotely in a practicable way by either of the above, the ultimate recourse is to supply them on a USB stick. There will however be an additional charge for this if it is not the Final Data Pack.
The delivery timeline for School Packs will be agreed separately with clients as ultimately it is up to them to decide when the best time is for their schools to receive them. Some common times are:-
- “UK Walk To School Week" in the second week of May.
- "International Walk To School Month" in October.
- as part of some other local initiative that will help raise the profile of active / suatainable travel within their local authority. This is where joint working may pay off as you can "ride the coat-tails" of some other initiative (or vice versa as far as your new partners are concerned).
Some clients even choose to deliver their STHC Packs personally to each school in the authority, where it can be used as a catalyst for initial discussions and hopefully, in the longer term, change on the ground. It is entirely up to clients what they do, but please feel free to contact us if you want any advice.
The Final Data Pack is the ultimate roundup of all the STHC Anlysis output in the one handy data stick. It will normally be delivered after everything else has, including STHC School Packs as the Pupil Travel Map image files and pDF versions of the STHc School report & Covering letter are included as part of the output.
If there needs to be a re-supply of the Final Data Pack due to technical errors with the client input Data, there will be a surcharge levied.
The processing time to produce standard digital analysis output is 2-3 working weeks, but this is dependant on all the client authority(ies) participating in the processing round supplying to Knowledge Mappers:-
- all "input data" to the required technical standard as instructed
- a valid Purchase Order
- a standard Mapping Services Agreement Contractors license for us to sign to enable us to work with your Ordnance Survey data (1st year of processing only)
- completed STHC Report and Covering Letter Template files as instructed
- authority logo and other graphic files as well as any specific instructions on their use
Note client officers need to be aware of the timing of the school census collection cycle within their authority. Mode of Travel data is collected from schools by the LEA in January of the school year. However it first has to be “cleansed and compiled” by LEA Information officers before it is released for analysis, which means it is not normally available to us until at least late February / March.
Where several authorities are acting in conjunction the delivery time may well be longer. We can only begin processing once we have all the required input data from all the authorities that agreed to participate in the “analysis round”.
The STHC begain in 2004 with one client authority, processing data we collected from schools ourselves on an individual basis. This section explores in more detail.:-
- the nearly 30 STHC client authorities (which doesn't include Transport for London (TfL), who were acting as a commissioning body on behalf of London authorities).
- the numerous client testimonials praising the STHC, most along the lines of "thanks for the great analysis data, it gives us the essential foundations to move forward and it also frees up our time to do the important work of actually delivering the change required".
- the numerous citations of the STHC within the sustainable / active travel literature as an example of best practice (including from the Chief Medical Officer of the UK Government as well as Regional Directors of Public Health Authorities).
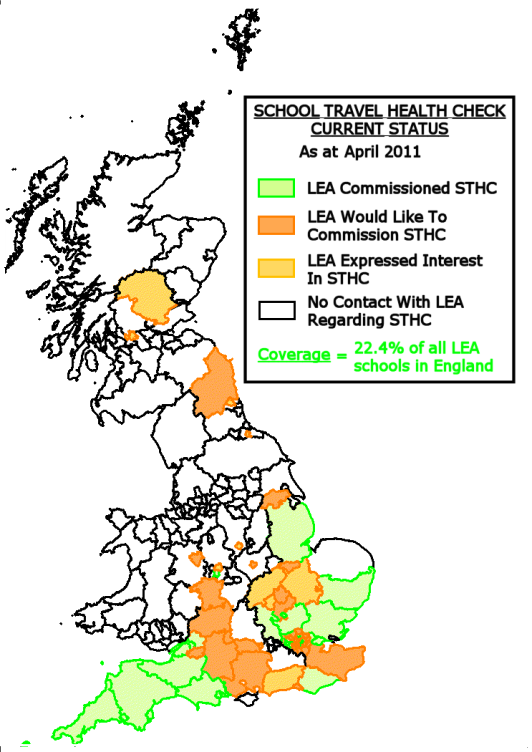 The School Travel Health Check Service is currently bringing proven benefits to nearly 30 UK local authorities,By March 2012 they had processed over 3.3 million pupil records from over 4,700 UK schools (some 22% of the LEA controlled schools in England).
The map opposite shows the current take up of the STHC as well as expressions of interest as far as we are aware at the time of writing (the map includes those authorities who signed up to our Local Sustainable Transport Fund (LSTF) bid).
Please contact us to find out what is happening with the STHC in your area or register your interest.
If we want to get rates of cycling and walking up to the levels of the best European communities we need to use this data to make sure our transport plans will make that happen. If we fail to take maximum advantage of this opportunity, we may fail our children.”
Dr Gabriel Scally Regional Director of Public Health for the South West
The Regional Public Health Observatory network exists to improve the health of the population in their region through the collection, monitoring and analysis of data, to produce evidence that will inform decision-making on health issues at local, regional and national levels. In the SW, where the STHC has been going longest, the Regional School “Healthy Schools” initiative. The data is published as part of their “Instant Atlas™ Mapping Tool to support Healthy Scools Plus” page on their website.
Albert Ward
School Travel Plan Team leader, Somerset County Council
Somerset was the authority in which the STHC was first developed way back in 2003-04, when mode of travel data was collected from each individual school! Albert has been involved since the beginning.
Phil Cornsih
School Travel Awareness Officer, Torbay Council
Torbay have commissioned the STHC since 2007-08, and have been distributing our STHC Packs to schools since 2008-09.
Emma Sheridan
Former London Regional School Travel Adviser for DfE & DfT and School Travel Manager, Transport for London and Modeshift Chair
Transport for London commissioned the STHC on behalf of 8 London Borough Councils on a pilot basis. Modeshift is the central forum supporting those who are working to achieve shift towards more sustainable and active travel for young people and school communities in the UK.
Ian Selby
School Travel Plans and SMOTS, Bournemouth Borough Council
Bournemouth first commissioned the STHC analysis for their 2007-08 school census data and so are part of the core of SW authorities that has contributed to its rapid development over the last year. They also commissioned STHC Paper Packs for the first time for 2008-09.
Kevin Speakman
School Travel Plans and SMOTS, North Somersetl
North Somerset also first commissioned the STHC analysis for their 2007-08 school census data but have also taken the STHC Paper Packs for all their schools from the start.
“We've been really impressed with the STHC here in Sandwell. We have most of our schools with travel plans already, so this information will be invaluable for us to take the Travelling to School Initiative to the next level by actually achieving mode shift! Hopefully being able to easily target schools with the biggest potential for mode shift we should be able to get some real results.”
Fleur Tooby
School Travel Adviser, Sandwell Metropolitan Borough Council
Sandwell were the first authority in the West Midlands region to commission the STHC in 2008-09, where it is being used very effectively at a day-to-day operational level.
Sharon Payne
East of England Regional School Travel Adviser, DfE & DfT and Sustainable School Travel Strategy Officer, Suffolk County Council
Suffolk County Council first commissioned the STHC analysis data for their 2008-09 school census data. They also commissioned us to produce our STHC Paper Packs on a pilot basis for a selected number of schools. As these were successfully received the plan is to roll them out to all (344) Suffolk LEA-controlled schools next year, as well use them as the foundation for formal lessons plans being drawn up for various Key Stages in different areas of the curriculum.
“We have had to prepare the transport model from scratch and have therefore been involved in an extensive and expensive data collection programme in order to assemble a comprehensive picture of travel patterns and behaviour across South East Dorset. We were therefore delighted to learn about the journey to school data which provided a fully observed picture of travel to school by the variety of modes. The journey to school data was particularly useful in filling in gaps in the travel demand matrices for journeys by private car and public transport. The level of detail and the comprehensive nature of the data meant that it was an ideal basis to supplement the other sources of data.”
“The Journey to school data was vital for us to be able to fill in the gaps between the different roadside interview sites. In other studies we have had to make simplifying assumptions about travel between the interview sites; to be able to use the Journey to School database was a real bonus for us.”
Robert Thompson
Business Manager Policy and Plans, Atkins Transport Planning
STHC data was supplied to Atkins, who were commissioned by Dorset County Council to undertake the South East Dorset Multi Modal Study (underpins LTP3 and MAA).
Stacey Olver
School Travel Adviser, Plymouth City Council
Plymouth have commissioned the STHC every year since 2007-08.
Trevor Jameson
Headteacher, St. George's Primary School, Portland
“Great to have some measurable targets / data to use to set future targets and develop the travel plan. Fantastic maps”
Headteacher
Heyeswood First School, Dorset
“Fascinating detailed information, well displayed, very visual. Will use alongside STP at next review.”
Headteacher
St Josephs School, Christchurch
In October 2009 eleven LEA run schools in Dorset received our STHC School Packs for the very first time. Above is some of the feedback received by the Dorset County Council Sustainable Travel Coordinator.
Soft Measures – Hard Facts: The Value For Money Of Transport Measures Which Change Travel Behaviour. A Review Of The EvidenceDepartment of Health / Highways Agency / NHS South West / Travelwise / South West Regional Development Agency (January 2011)
The STHC is cited throughout this review document as the essential evidence base to guide and support intervention on active travel to school.
“This innovative sustainable development initiative aims to provide robust data that will allow schools, planners and individuals to develop more sustainable school travel options.”
“Active travel to school is an important source of physical activity for young people. It could be increased further. These statistics provide a useful baseline against which to measure progress, and should be used in conjunction with a qualitative assessment of local authority and school travel policies.
"The value of each additional young person walking to school has been estimated as £768 from health, less congestion and carbon savings." (p33)
Download the full document from our website here (.pdf, 2.6 MB).
Promoting Active Travel to School: Progress and PotentialModeshift / Department of Health / NHS South West (November 2010)
The STHC is cited throughout this briefing paper produced to answer the main questions health professionals often ask about promoting active travel to school:-
- How far can young people reasonably be expected to walk or cycle to school?
- Is any progress being made to get more young people active by promoting walking or cycling to school?
- What is the potential for encouraging more young people to walk or cycle to school?
- What can be done to get better value for money?
Download the full document from our website here (.pdf, 0.5 MB).
2009 Annual ReportUK Government Chief Medical Officer
The STHC is cited as the example of best practice for public health in the South West Region in the 2009 Annual Report of the UK Government Chief Medical Officer (see "Increasing active travel by schoolchildren" - p73). "The synergies between improving health and slowing climate change should be championed by the Government and health leaders to drive bold lifestyle changes." [Recommended Action]
“This innovative sustainable development initiative aims to provide robust data that will allow schools, planners and individuals to develop more sustainable school travel options.”
“Active travel to school is an important source of physical activity for young people. It could be increased further. These statistics provide a useful baseline against which to measure progress, and should be used in conjunction with a qualitative assessment of local authority and school travel policies.”
Download the full document from our website here (.pdf, 3.6 MB).
Towards A School Carbon Management PlanSustainable Development Commission (SDC) and the Department For Children, Schools & Families (DCSF) (June 2009)
In June 2009 the SDC and the DCSF jointly published this consultation document. In Section D covering Reducing emissions from school travel and transport, Dorset County Councils use of the STHC is the only example cited of the best use of existing data to inform individual schools of their performance and to identify actions.
“School Travel Plans are only as good as the data on which they are developed. Establishing better quality data sources to underpin School Travel Plans could help schools and School Travel Advisors to target their activities more effectively.
It could also provide a basis for more consistent monitoring (for example, establishing a consistent method of measuring the impact of schemes, benchmarking of activities and comparison of schools and local authorities).
Improved school travel data can also link into local authority work on National Indicator 186 (Per Capita Carbon Emissions in the local authority area). In particular, it can help local authorities to better understand the impact of school travel and the opportunities for interventions.
Existing data sources can be better used (as evidenced by the Dorset County Council [STHC] case study). It is important that Regional and Local School Travel Advisers understand the data that is available to them and how it can be used and interpreted. Existing data can also be used to inform individual schools of their performance and to identify actions.”
Download the full document from our website here (.pdf, 0.4 MB).
We realise that when dealing with analysis of individual pupil data and showing results on maps, clients will have concerns about data protection. However we have been undertaking the STHC since 2004 and have never had any complaints from client authorities on data protection grounds. We think our measures strike a sensible balance between maintaining pupil anonymity, yet still allowing us to produce accurate and detailed enough distance analysis calculations for both strategic and operational purposes in a process that can be carried out for any local authority in the UK.
We take the whole data protection issue very seriously and hope to put your mind at rest in the rest of this section:-
- Details of our registration with the Office of the Information Commissioner
- Our responsibilities for your data as your supplier
- Further de-personalisation measures we take
- Data Portal Measures
- Fitness For Purpose of our analysis
If you have any concerns about Data Protection then please contact us and we will be happy to discuss them with you.
As your supplier:-
- the data you supply to us is at all times your property and they are free to inspect our offices to ensure that it is being processed in accordance with due diligence.
- we will only use any data you supply for the stated purposes.
- we will only allow authorised personnel to have access to it.
- we will not share it with 3rd parties.
We are happy to sign any additional data sharing protocols that your authority requires.
A number of technical measures to further de-personalise what is in fact already very de-personalised data are built in to the STHC analysis process:-
- use of pupil postcode centroids, not their home address.
- dispersal of the geocoded pupils around the postcode centroid point.
- use of our own unique pupil identifier for each pupil record in the analysis process. Note: The Unique Pupil Reference Numbers (UPRNs) that are part of the original input data will only appear in the STHC output data supplied directly to the client to enable them to cross-reference it with other pupil data they hold. They will never appear in the data portal output.
The whole purpose of the STHC service is to produce analysis data that can be shared by all the stakeholders interested in how children travel to school and how far they travel to get there. It therefore defeats our purpose if data protection concerns prevent this from happening. At the same time we have to take due cognisance of the genuine concerns there are around data protection. Within our Data Portal a number of measures exist to address these:-
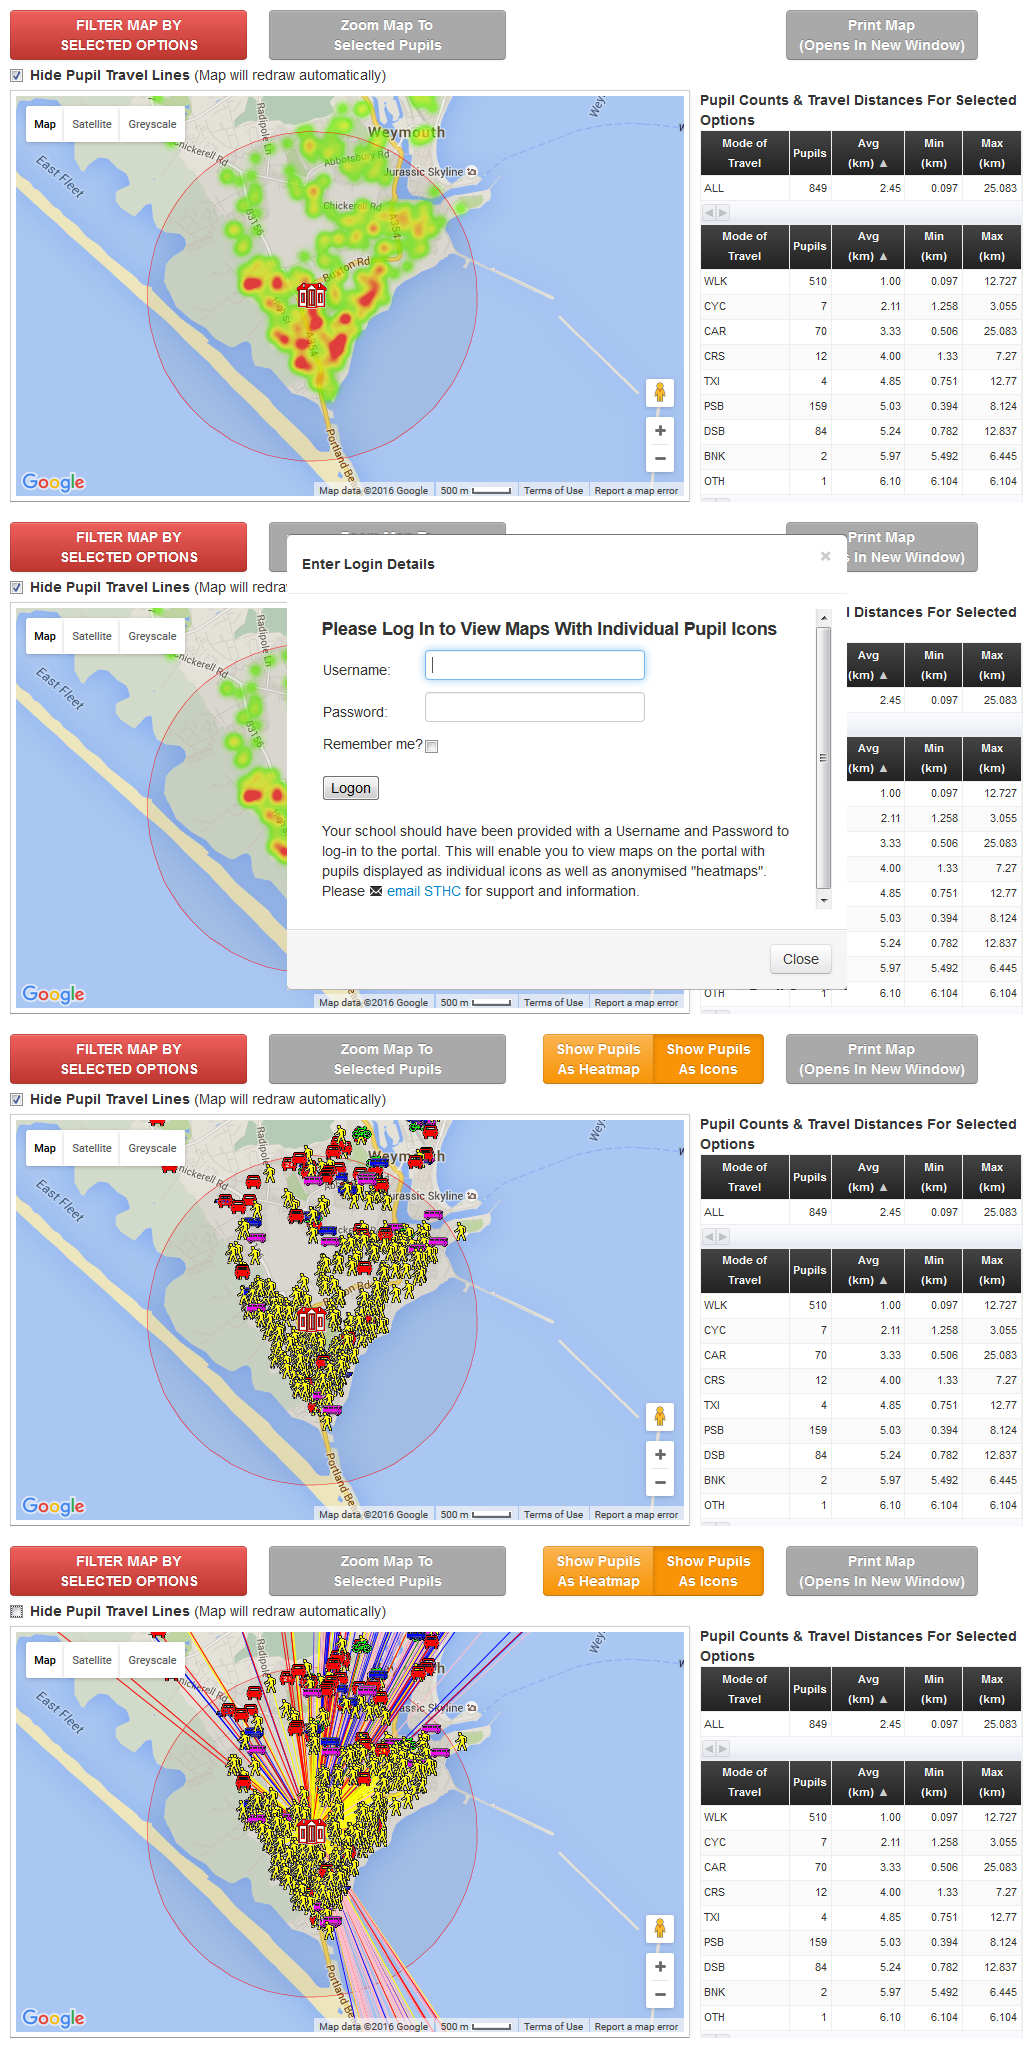
In our extensive experience when resources are "locked away" behind password-protected websites they don't get used as often as they should do (if at all), by everybody that should be using them. Often when the password-holder moves on they forget to leave a note of the password behind them and then nobody can get access (if they told anybody else about it in the first place of course!).
Through the STHC Data Portal a client authorities analysis results are made as publicly accessible as possible, but with password protection granting variable levels of viewing rights where it is absolutely required. This is namely any maps showing individual pupils icons, which are otherwise rendered as generalised “hot spot maps” to unregistered users.
In practical terms this means there are 3 login levels for the STHC Data Portal:-
- No Login (Public) - All pupil-level maps rendered only as heatmaps (top picture, right).
- School Login - Onced logged in (2nd picture), pupil-level maps for their school can be rendered as individual pupil icons (with or without travel lines - 3rd and 4th pictures right), or heatmaps. Users can toggle between either using the orange, on-screen buttons that appear on log-in. Pupil-level maps for all other other schools however are rendered only as heatmaps.
- Local Administrator Log-in - Pupil-level maps for all schools in the authority can be rendered as individual pupil icons (with or without travel lines), or heatmaps. Users can toggle between either using on-screen buttons. This would be reserved for the main contact officer based in the client authority and any colleagues that they nominated in writing to us.
Schools are assigned login details by us. How they are notified of these is up to the client. It is usually in writing in an additional document included in the STHC School Pack sent to all schools, but it could also be by email if we are provided with the appropriate contact email addresses.
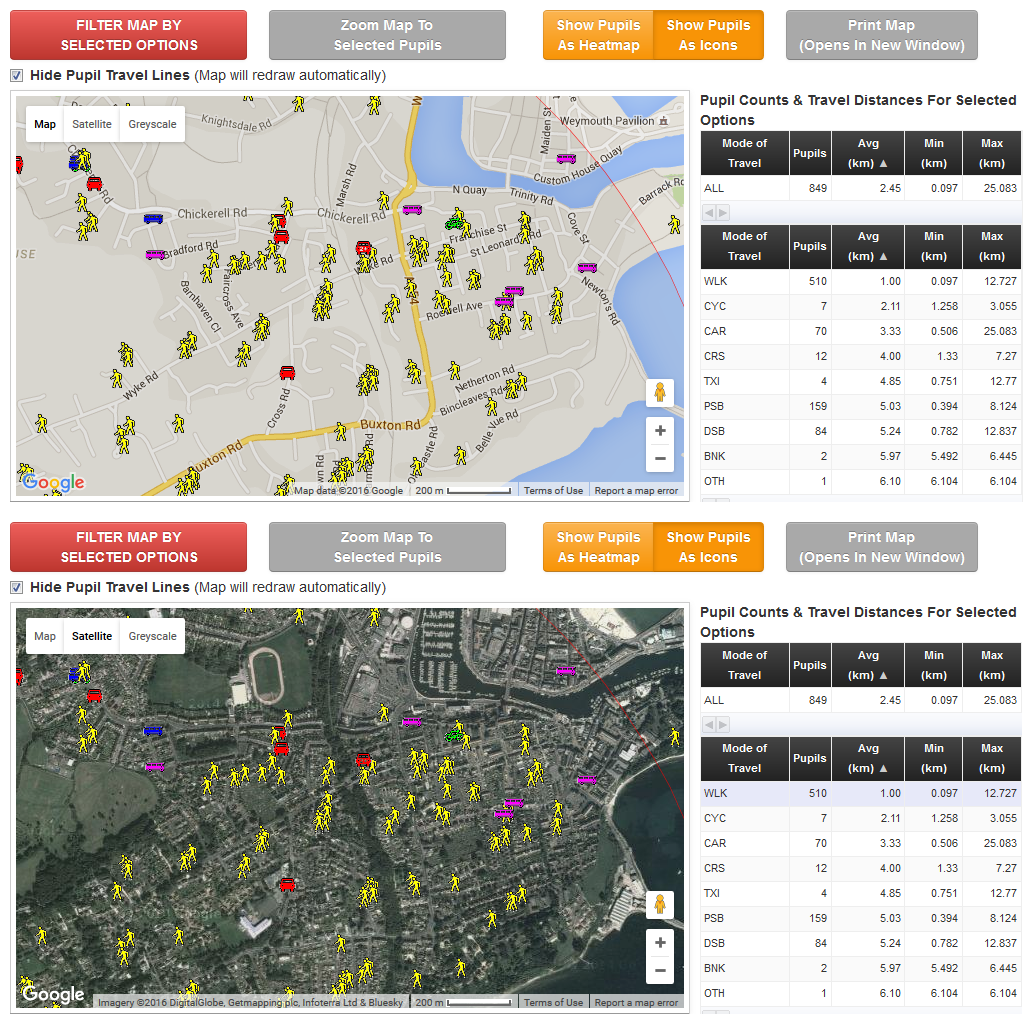
The zoom range of the map windows in the STHC Data Portal are controlled by us. The screenshot to the right shows the current maximum level of zoom available to users with both the usual Google Map background and the satellite imagery background. Bear in mind also that the pupil icons shown on the map have already been subject to the further depersonalisation issues discussed elsewhere in this section.
Thus we believe our maps strike a sensible balance between indicating to users the general area where pupils are travelling from in sufficent enough detail to be useful to stakeholders, but in a way that doesn't compromise data protection or pupil anonymity.
The whole purpose of the STHC service is to produce analysis data that can be shared by all the stakeholders interested in how children travel to school and how far they travel to get there. It therefore defeats our purpose if data protection concerns prevent us doing this.
The simple truth of the matter is the less detailed the input data, the less useful the analysis results can be. If we are trying to effect behaviour change in the individual pupil, we need to analyse individual pupil-level input data over time if we want to monitor how the situation is changing over time. Otherwise how are we supposed to have any idea if the measures we are undertaking on the greound are having any effect?
No doubt we will expand this section in future but for now, if you have any concerns about Data Protection then please contact us and we will be happy to discuss them with you.
We aim to be the repository for all things useful to know in the world of sustainable / active travel to school. This section contains downloadable resources regarding:-
- STHC Guide Documents - everything you and your colleagues need to know about the School Travel Health Check service in handy documents.
- Local Sustainable Transport Fund (LSTF) - background information about the only show in town / beacon of hope for sustainable travel funding, as well as details about our (ultimately failed) bid for LSTF funding on behalf of our client authorities.
- National School Census - the tale of woe that is the unilateral decision by the English Department for Education to withdraw the Pupil Usual Mode of Travel collection as part of the National School Census, thus undoing much of the gains made in the previous 5 years under the national Travelling To School Initiative.
Our STHC Guidance documents provide an overview of the service, what input data is required (and why), describe the analysis output and suggest uses for the data in the local authority environment. The STHC is continuously being reviewed and updated in response to the ever changing data and policy environment as well as advances in data visualisation technology. Thus these guides will be updated on a regular basis and, as with all other aspects of the STHC, we welcome any feedback and ideas from users on how to improve them.
STHC Guide 1 - Overview (v3.6, July 2013)
This guide gives an overview of the STHC – the input data required from client authorities, the basic analysis process, what exactly they get back as standard output and what they may want to commission as an additional service, the benefits it will bring them, who else is doing it already, how much it will cost them and the delivery timescales for them receiving their analysis data. Finally there is some discussion about data protection issues. This guide should be freely distributed to colleagues, managers and potential partners as part of the internal awareness raising process.
Click here to download the STHC Guide 1 - Overview document (.pdf, 1.4 MB).
STHC Guide 2 - Client Input Data (v3.3, July 2013)
This guide describes in more detail the datasets client authorities need to supply to us (the “Client Input Data”) in order for us to undertake the School Travel Health Check. It has been produced to tell client officers what datasets we require, how they fit into our analysis process and whom they need to contact within their authority to get hold of them. However it has also been designed to be read by Data Holders to inform them why this data is being requested from them by the officer and what they need to supply at a technical level (they need only read the sections about the datasets they are concerned with!).
Click here to download the STHC Guide 2 - Client Input Data document (.pdf, 1.4 MB).
After a 2 tranche bidding process that ended in September 2012, the Department for Transports Local Sustainable Transport Fund (LSTF) is now in the course of providing £600 million to successful local authorities in England to fund sustainable travel projects.
We would very much encourage local authorities to use some of their hard-won LSTF funding to commission the STHC (if they haven't done so already) to ensure they have a secure, spatial-analysis evidence base to monitor the impact of their projects going forward. It will be easier to source future funding to maintain projects if they have a proven and quantifiable record of success. (Working out at less than £0.16 per pupil for standard processing plus STHC School packs for every school in the authority, we think our costs are very reasonable and our transparent pricing formula means that clients can work out in advance how much a years STHC will cost them. Our flexible invoicing makes it easier for our clients to juggle their budgets too!)
![]() The Local Transport White Paper "Creating growth, cutting carbon: making sustainable local transport happen", published in January 2011, placed localism at the heart of the transport agenda in order to cut carbon emissions and create local economic growth. The Local Sustainable Transport Fund (LSTF) established by the Department for Transport made available a total of £560 million to fund local authority sustainable travel projects in a 2 tranche bidding process. Funding was topped up with a further £40 million to £600 million in 2012 to accommodate approval for a greater number of bids, with match funding being provided by local authority partners. In total DfT awarded funding to 96 packages from 77 authorities to deliver their schemes between 2011 and 2015. Along with local contributions provided by all funded project teams, over £1 billion is now being invested in local sustainable travel.
The Local Transport White Paper "Creating growth, cutting carbon: making sustainable local transport happen", published in January 2011, placed localism at the heart of the transport agenda in order to cut carbon emissions and create local economic growth. The Local Sustainable Transport Fund (LSTF) established by the Department for Transport made available a total of £560 million to fund local authority sustainable travel projects in a 2 tranche bidding process. Funding was topped up with a further £40 million to £600 million in 2012 to accommodate approval for a greater number of bids, with match funding being provided by local authority partners. In total DfT awarded funding to 96 packages from 77 authorities to deliver their schemes between 2011 and 2015. Along with local contributions provided by all funded project teams, over £1 billion is now being invested in local sustainable travel.
The funding announcements made were as follows:
- 11 September 2012, Ministers approved just under £5 million to Tyne and Wear ITA for a small project, based on the strongest elements of their Large Project proposal (which was turned down for funding in June 2012)
- 27 June 2012, Ministers awarded £225 million to 12 large projects (above £5 million), plus £41 million to 14 tranche 2 projects (small projects up to £5 million)
- 24 May 2012, Ministers awarded £113 million to 30 tranche 2 projects (small projects up to £5 million)
- 5 July 2011, Ministers awarded £155 million to 39 tranche 1 projects (small projects up to £5 million)
Click here to see the list of all LSTF projects, including the bids that were unsuccessful.
 Thanks to the 27 authorities that signed up to our LSTF bid with Dorset County Council. Had we been successful, funding to provide the full STHC analysis service with additional STHC School Packs to every school in the bid authorities on an annual basis until 2015 would have been secured.
Undaunted the STHC carries on under the existing funding model and we encourage local authorities to build the STHC into their projects from the start (if they haven't done so already). Please contact us for further information on the use of the STHC in LSTF funded projects.
STHC / Dorset County Council LSTF bid partner authorities:-
- Bournemouth Borough Council
- Brighton and Hove City Council
- Buckinghamshire County Council
- Cornwall Council
- Essex County Council
- Gloucestershire County Council
- Hampshire County Council
- Hertfordshire County Council
- Kent County Council
- Leicester City Council
- Lincolnshire County Council
- North Lincolnshire Council
- Luton Borough Council
- Northumberland County Council
- Plymouth City Council
- Poole Borough Council
- Reading Borough Council
- Sandwell Metropolitan Borough Council
- Suffolk County Council
- Swindon Borough Council
- Telford & Wrekin Council
- Thurrock Council
- Torbay Council
- West Berkshire Council
- Wiltshire County Council
- Worcestershire County Council
Click here to download the STHC / Dorset County Council LSTF Bid document(.pdf, 1.4 MB).
On the 29th July 2011 the Department for Education announced that in order to “reduce bureaucracy”, Pupil Usual Mode of Travel had been immediately dropped as a data field from the National School Census. This section tells the story of this as best we can determine. Note that despite all of these "shenanigans at the centre", we continue to offer the School Travel Health Check Service to all interested local authorities. Even in the absence of pupil usual mode of travel there is much useful distance information that can be derived from spatial analysis of basic pupil postcode data, which will always be a critical component of national school census.
- Background To The Removal Of Pupil Usual Mode Of Travel From The English National School Census
- Document Download Trail
On the 29th July 2011 the Department for Education announced in the pages of issue no. 50 of the Information about children, education and schools (ICES) e-bulletin that they had unilaterally decided to remove the Pupil Usual Mode of Travel data field from the English National School Census with immediate effect. This was much to the surprise of ourselves and other providers of data analysis services, not to mention all other government departments, local authorities and schools who were reliant on the data for many of their own strategic planning and operational purposes. In this section of the website we do our best to get to the bottom of this uncharacteristically swift action by the DfE, and the reaction of the school travel community to it.
Update: On the 2nd of February 2012 The Department for Transport invited interested parties from local and central government (but sadly not the providers of data analysis services used by government!) to a round-table discussion on the possible way forward for the continued collection of mode of travel data from schools on a national basis. The general consensus of the meeting was that it was impossible for this data to be collected on a national basis outside of school census within the resources and timeframe available, and that the simplest solution all round was that the Department for Education should re-instate the mode of travel into the school census but make it a voluntary field (ie. if it's filled in it's collected during the automatic data upload process, if it's not it's left blank but its absence doesn't cause any data integrity problems further down the line). Despite this being not at all technically difficult to do, and that schools will continue to collect the data from their pupils anyway becasue their information management system still allows them to and it's collection often is part of classroom lessons, the DfE steadfastly refuse to do this and are unlikely to change their mind. Thus despite the contention from DfE that removal of mode of travel from school censsus will reduce bureaucracy in schools, it will lead to a dramatic increase in bureaucracy for those schools and local authorities that still wish to collect the data because they realise the value of knowing how their pupils travel to school and how far they travel to get there.
You can piece together the whole sorry tale and come to your own conclusions by downloading the documents below. The STHC Briefing Paper to the wider School Travel Community is a good place to start. In this section you can view / download the following documents:-
- STHC Briefing Paper
- ICES Bulletin #49 (June 2011)
- ICES Bulletin #50 (July 2011)
- ModeShift Briefing Paper
- ModeShift Press Release
- ModeShift Letter To Schools Minister
- Dorset Letter To Schools Minister
- STHC Letter To Schools Minister (and his reply)
- STHC Letter to Enterprise Minister (alas no reply)
STHC Briefing Paper On The Sudden Announcement By DfE That The Pupil’s Usual Mode Of Travel Field Is No Longer To Be Collected As Part Of The School Census (2nd August 2011)
This paper contains the “facts” of the matter around the announcement as far as could be gleaned from the DfE website at the time, and was the basis for the ModeShift briefing paper sent round the school travel community. The hope was that it contained enough background information, direct quotes and points of contact to enable all the stakeholders who currently benefit from the collection of mode of travel data through National School Census to successfully engage with officials within DfE, and the relevant Minister For Schools (one Nick Gibb, MP for Bognor Regis in West Sussex), to get this decision reversed.
According to DfE officials these changes were all happening at the insistence of the minister, which presumably is why they had been implemented unilaterally, without any exteranl consultation with the local authority active and sustainable travel community, and against long established departmental procedures controlling changes to the contents of the School Census (ie. the so called "Star Chamber Scrutiny Board").
Click here to download the STHC Briefing Paper document (.pdf, 0.1 MB).
 Information about children, education and schools (ICES) e-bulletin #49 (June 2011)
The June edition of the official DfE technical bulletin which, in its article reviewing proposed changes to the School Census, does not even mention that removal of the "Pupil Usual Mode of Travel field" was even being considered, or that there was a "comprehensive root and branch review" of the school census taking place.
Click here to download the (ICES) e-bulletin #49 document (.pdf, 0.1 MB).
 Information about children, education and schools (ICES) e-bulletin #50 (July 2011)
The July edition of the official DfE technical bulletin which announced that, not only had the "Pupil Usual Mode of Travel field" now been removed from the School Census but also that the alterations to the technical specs for the school information management systems had already been implemented by the software vendors.
Click here to download the (ICES) e-bulletin #50 document (.pdf, 0.1 MB).
 ModeShift Briefing Paper For Local Authorities On The Removal Of Pupil Mode Of Travel From National School Census (August 2011)
Modeshift is the national membership organisation that specialises in active and sustainable travel and provides behaviour change support for those working with children, young people, families, school communities and educational establishments. This briefing paper was produced by them and circulated round the local authority active and sustainable travel community to raise awareness of the DfE removal of Usual Pupil Mode of Travel from School Census. As mentioned already this action was taken suddenly and unilaterally by DfE without any external consulation (certainly not via their official bulletin anyway) so many local authorities were unaware of it.
Click here to download the ModeShift Briefing Paper document (.pdf, 0.2 MB).
 ModeShift Press Release On The Removal Of Pupil Mode Of Travel From National School Census (25th August 2011)
Once again Modeshift endeavour to get the word out.
Click here to download the ModeShift Press Release document (.pdf, 0.3 MB).
 ModeShift Letter To Schools Minister Nick Gibb MP (26th August 2011)
ModeShift put the national case for re-instatement of Mode of Travel to Schools Census to the Schools Minister.
Click here to download the ModeShift Letter To Schools Minister document (.pdf, 0.1 MB).
 Dorset County Council Letter To Schools Minister Nick Gibb MP (25th August 2011)
Dorset County Council, (one of our STHC authorities) put the local case for re-instatement of Mode of Travel to Schools Census to the Schools Minister.
Click here to download the Dorset County Council Letter To Schools Minister document (.pdf, 0.1 MB).
 STHC Letter To Schools Minister Nick Gibb MP (13th September 2011)
Our frankly "bloody livid" letter putting the case for re-instatement of Mode of Travel to Schools Census to the Schools Minister from the data services industry perspective. Our main points were:-
- Lack of transparency or open-ness - There seems little point in having well advertised, apparently stringently applied, school census data collection policies & procedures, developed by data management professionals over several years, if they are going to be ignored just because the new minister thinks “wouldn’t it be a good idea if ….. “. The Star Chamber Secretariat have been unable to provide the written business case that, according to the official DfE data collection policy guidelines, must always be submitted before a decision on any change to the school census can be made. This lack of open-ness flies in the face of the Prime Ministers assertions that his is one of the most “open, accountable and transparent governments there is” when it comes to data - well according to his recent speech on the Data.gov website anyway!
- Lack of consultation with data stakeholders, especially end users - We have developed the STHC service over the last 5 years in partnership with local authority end users and with the full knowledge of the DfE Travel To School Initiative Board. By 2011 we had processed over 3 million pupil mode of travel records from over 4,800 UK schools - some 22% of the LEA controlled schools in England. I think we can therefore safely claim to be a major stakeholder and end user of school census data. However the first we, or any of our 29 local authority clients, knew about any change to mode of travel data collection was a “fait accompli” announcement that it was going to be dropped from the national school census , and the SIMS software supplier specifications had already been changed.
- Lack of consultation with, and regard for, the Data Services industry - SME’s such as ourselves are the backbone of the UK “knowledge economy”, one of the things that is apparently going to pull this country out of recession. Using our specialist skills and resources that are usually not available “in-house” to many organisations, we build targeted information products and services on the back of the bewildering deluge of available data. However no matter how innovative and well received those products are, there is little long term future for SMEs like us investing all our time and financial resources developing them in collaboration with one part of government, if another part of government is going to pull the rug out from underneath us, without any prior warning and apparently acting on a ministerial whim.
We have existing local authority clients who have already commissioned the STHC from us right up to 2012-13, how are we to provide them with the service they have paid for if there isn’t any data to analyse? How is this decision going to save them money?
We are also currently in talks with the Department of Health to develop the STHC to meet the needs of the Directors of Public Health now coming into local authorities. How are we going to grow our business to support the publicly stated government agenda if there is an axe hanging over the core analysis dataset - Lack of publicity - For what is effectively a major u-turn in government data collection policy, it smacks of trying to sneak things through “on the quiet” to announce it only via a monthly, technical e-bulletin, and then as a “fait accompli”. Note that the previous month’s (June) edition gave no indication that the removal of the Mode of Travel field was even being considered in an article outlining, bullet point by bullet point, the proposed changes to the 2011-12 school census
- Unseemly haste - Piecing together the trail of various DfE communications over the last few weeks would indicate that the entire process - from first “why don’t we …?” thought out of nowhere by somebody within DfE, to the “limited” internal consultation, to the final decision, to the uncharacteristic, last minute re-issuing of official technical guidance to SIMS software suppliers - happened in less than 4 weeks. Now that’s fast for any organisation let alone the leviathan that is the Department for Education! Anyone might think that the Minister for Schools or one of his close advisors almost had a personal vendetta against mode of travel data!
- Going against the tide of national “public good” data initiatives - There are many “public good” national data initiatives going on right now that we and the rest of the spatial data community are doing our best to help facilitate – Open Data, Data.gov, the European INSPIRE directive on environmental data, the UK Location Program to name but a few. Your department is even actively participating in some of these – I note that school level census data is available to be downloaded from the Data.gov website.
You will know then that at their heart, these initiatives are all about “joining up” data (government collected or otherwise) and using it in new and innovative ways to help tackle the complex issues of the world. “Collect once, use many times for as many different purposes as possible” is just plain, common sense. It is widely recognised that not only will this enable better, evidence-based formulation and execution of government policy, but it will actually make government as a whole more efficient and save us all money in the longer term. Thus this decision to no longer collect at a national level a core dataset that is key to tackling issues of national interest like child obesity and climate change, is ill-founded and a serious step backwards for the UK.
Click here to download the STHC Letter To Schools Minister document (.pdf, 0.3 MB).
 Letter Of Reply From The Education Minister (23rd September 2011)
This is the reply from the Start Chamber Secretariat on behalf of the minister. Apart from changing a couple of words it is the same reply that went out to the local authorities that wrote to him and does not address any of our points above on the lack of transparency or following existing departmental procedures with regard to changes to school census.
Click here to download the Letter Of Reply From The Education Minister document (.pdf, 0.5 MB).
 STHC Letter to Enterprise Minister Mark Prisk MP (14th September 2011)
Alas we received no response from the Minister at the Department for Business, Innovation & Skills on our specific points about the anti-business way in which the DfE have gone about this process.
Click here to download the STHC Letter to Enterprise Minister document (.pdf, 0.3 MB).
29
different client local authorities3.3 m
individual pupil data records5,100
separate UK schools~25%
of schools in EnglandWe think the STHC gives unparalleled insight and represents outstanding value for money:-
£0.15 - £0.22
average cost per pupil for Standard Output and School Packs (depending on school set up within an authority)We are however constantly striving to improve and expand it. Please contact us if you have any feedback / suggestions.
The School Travel Health Check - as used by
![]()
![]()
![]()
![]()
![]()
![]()
![]()
![]()
![]()
![]()
![]()
![]()
![]()
![]()
![]()
![]()
![]()
![]()
![]()
![]()
![]()
![]()
![]()
![]()
![]()
![]()
![]()
![]()
![]()
Please contact us to find out what the School Travel Health Check spatial analysis service can do to help you engage simultaneously with all your schools (whether or not they are academies, actually collect pupil usual mode of travel or have a travel plan), and to better target your behaviour change resources to achieve modeshift to more active and sustainable modes of travel on the "school run".